Anthony Davis, #3, Los Angeles Lakers, (Photo by Harry How/Getty Images)
Using hand-tracked player locations to examine two different approaches that NBA teams are using to balance offensive rebounding and transition defense.
Dwyane Wade stands in the foreground with his arms outstretched, nonchalantly waiting for his pass to find its mark. LeBron James — midair and frozen impossibly high above his teammate’s shoulder — floats, an instant away from slamming the ball home. And in the background, Milwaukee defender Luc Mbah a Moute is left agape in awe. It’s an absolutely iconic basketball photo (credit to Morry Gash for the great shot); but can you remember what happened just before that memorable scene unfolded? Do you recall the details of the Bucks possession that preceded the high-flying fast break?
That’s right — the play that set up that dunk was a failed offensive rebound chance. A 3-point shot went up from the wing. Andrew Bogut jostled underneath the hoop for position, Larry Sanders rushed from the top of the key toward the rim, and Mbah a Moute crashed the boards from the corner. All three Bucks managed to tip the ball before it reached Wade (and then, a few moments later, James).
Offensive rebounding philosophies have shifted a bit since that frigid Milwaukee night in December of 2010. All around the league, fewer missed field goals are being rebounded by the offensive team — from 30 percent in the 2010-11 season down to just 26 percent this year. Every player who attacks the offensive glass is one less player who can get back on defense to stifle fast-break opportunities for the other team — and the league-wide decline in offensive rebounds implies that teams are increasingly prioritizing transition defense. But, in confronting the tradeoff between crashing and getting back, every team must strike its own balance.
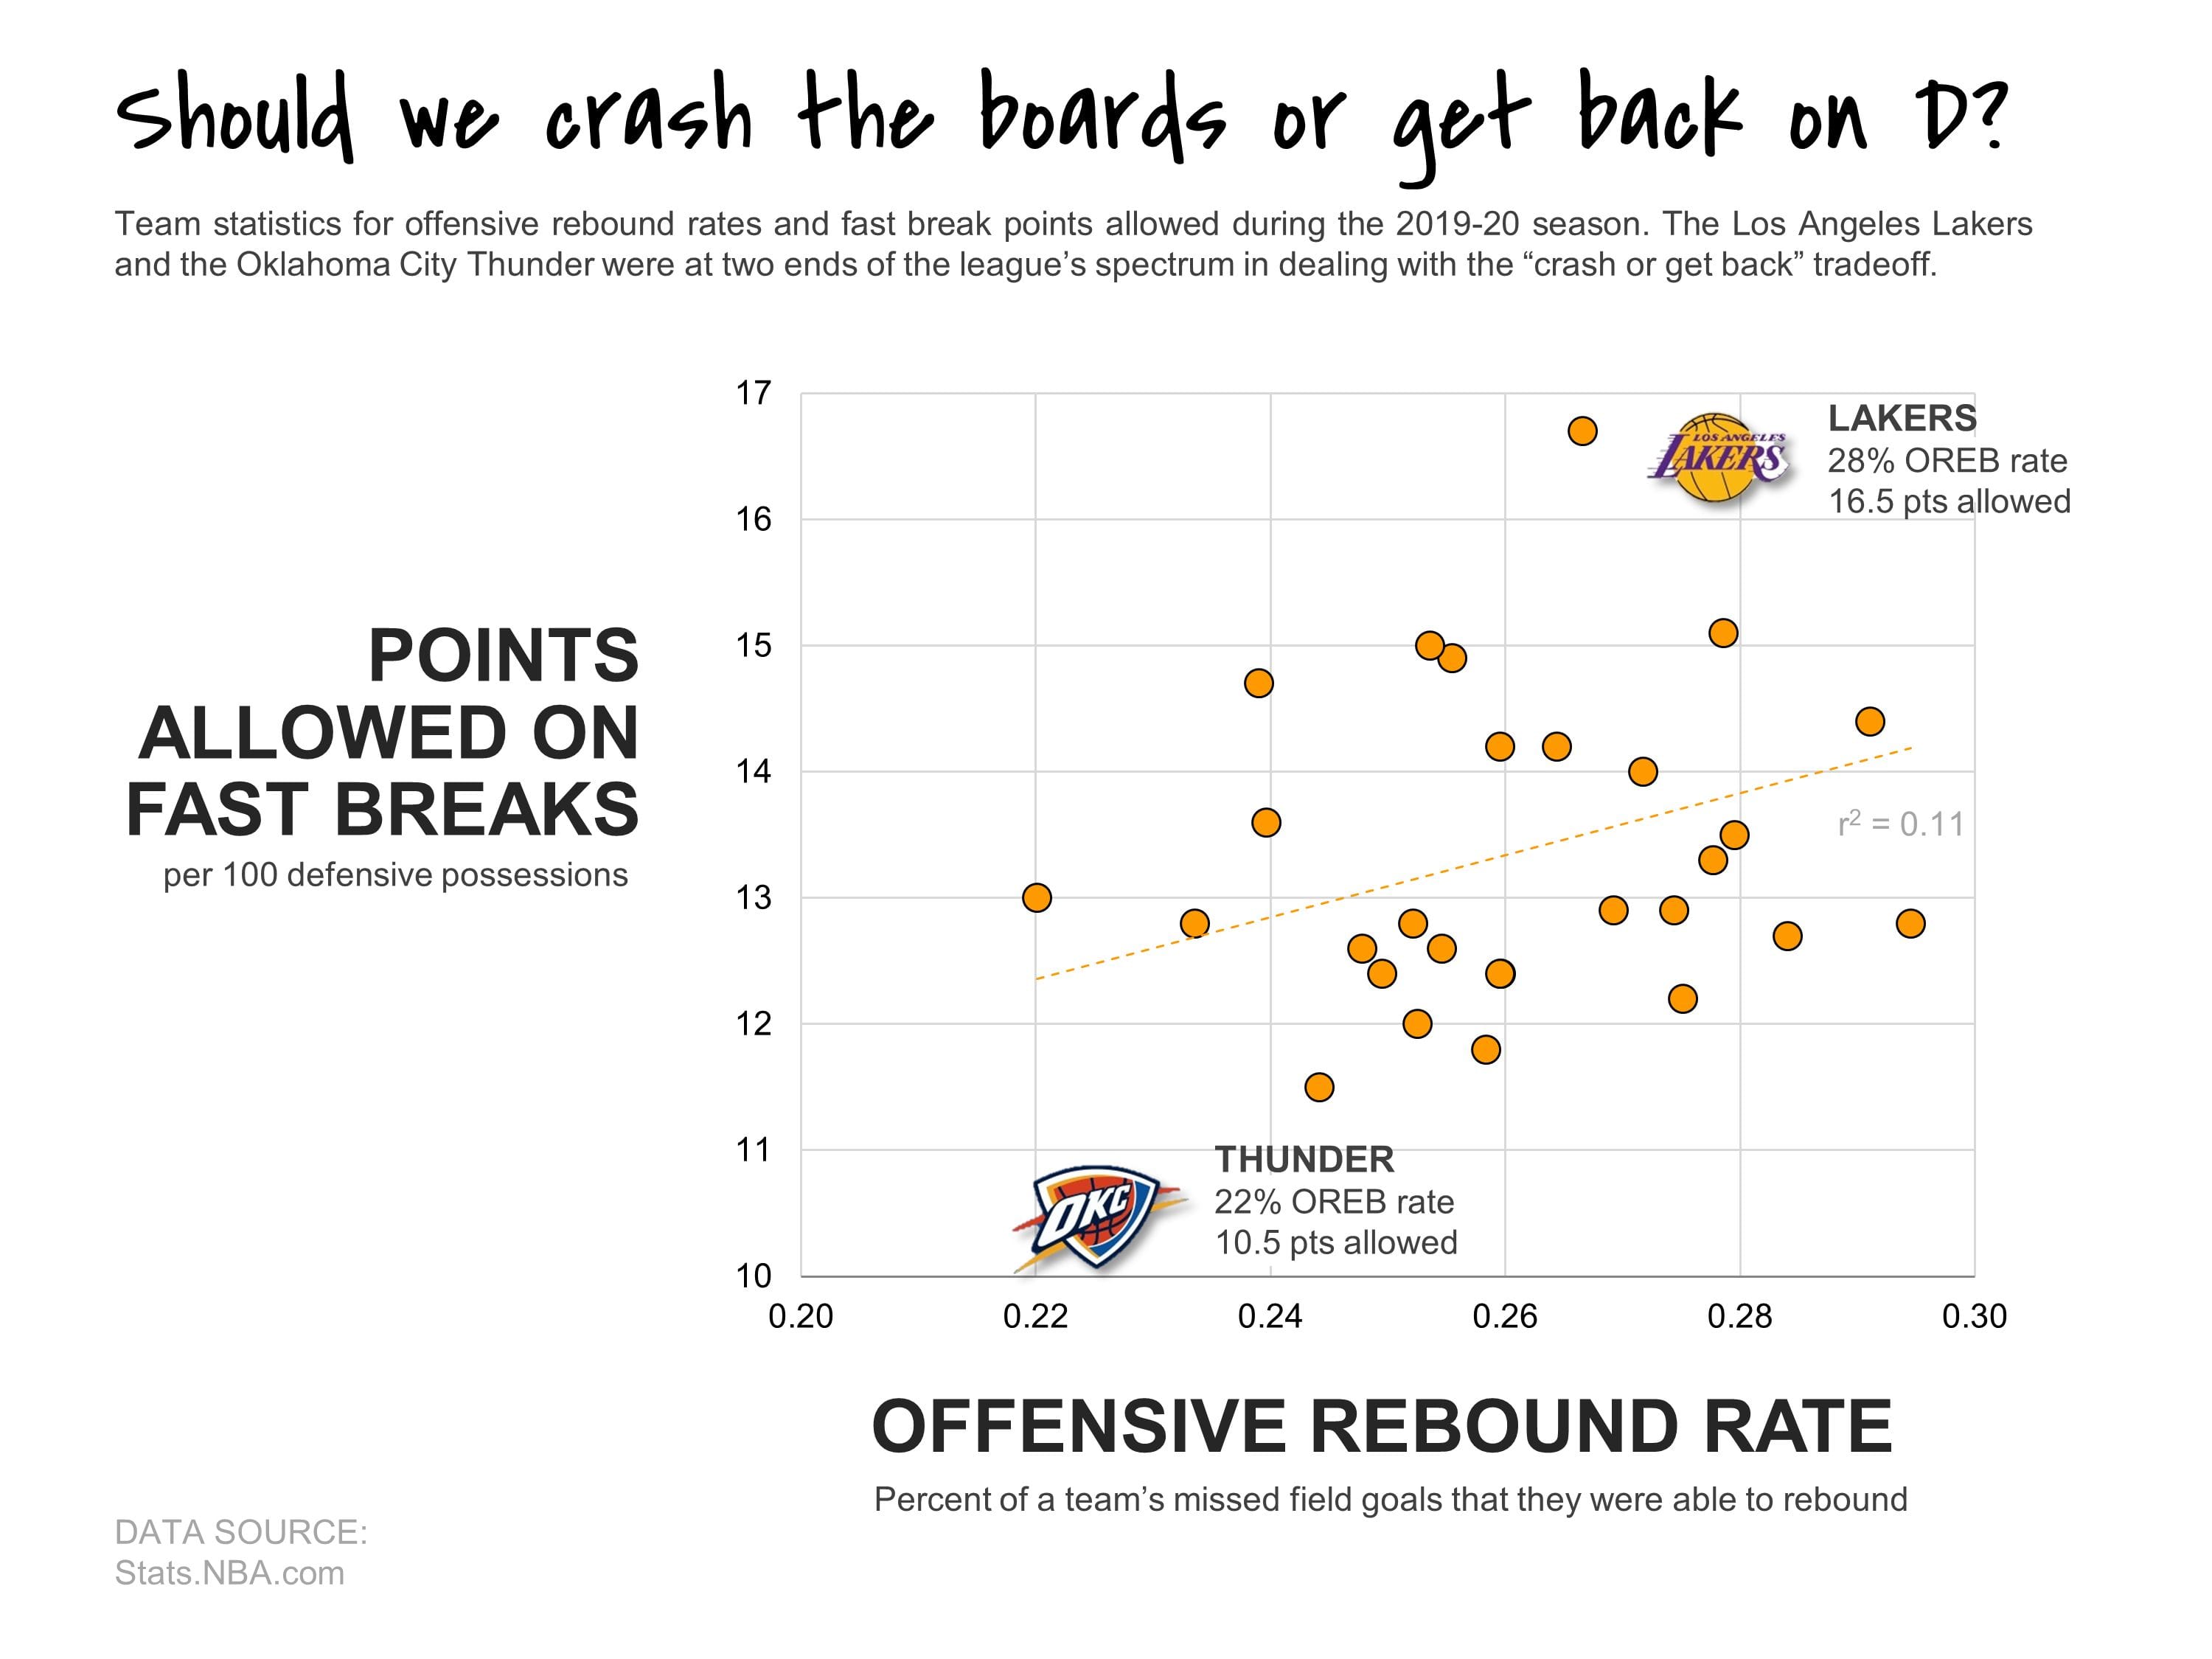
To crash the glass or get back on defense?
The Lakers and Thunder are taking two very different approaches to the crash-or-get-back conundrum. The Lakers have one of the league’s highest offensive rebound rates on missed field goals (28 percent) and, correspondingly, they have the second-highest rate of fast-break points allowed (16.5 per 100 possessions). In contrast, the Thunder have one of the league’s lowest offensive rebound rates on missed field goals (22 percent) and they are giving up the least fast-break points (10.5 per 100 possessions) of any team in the league.
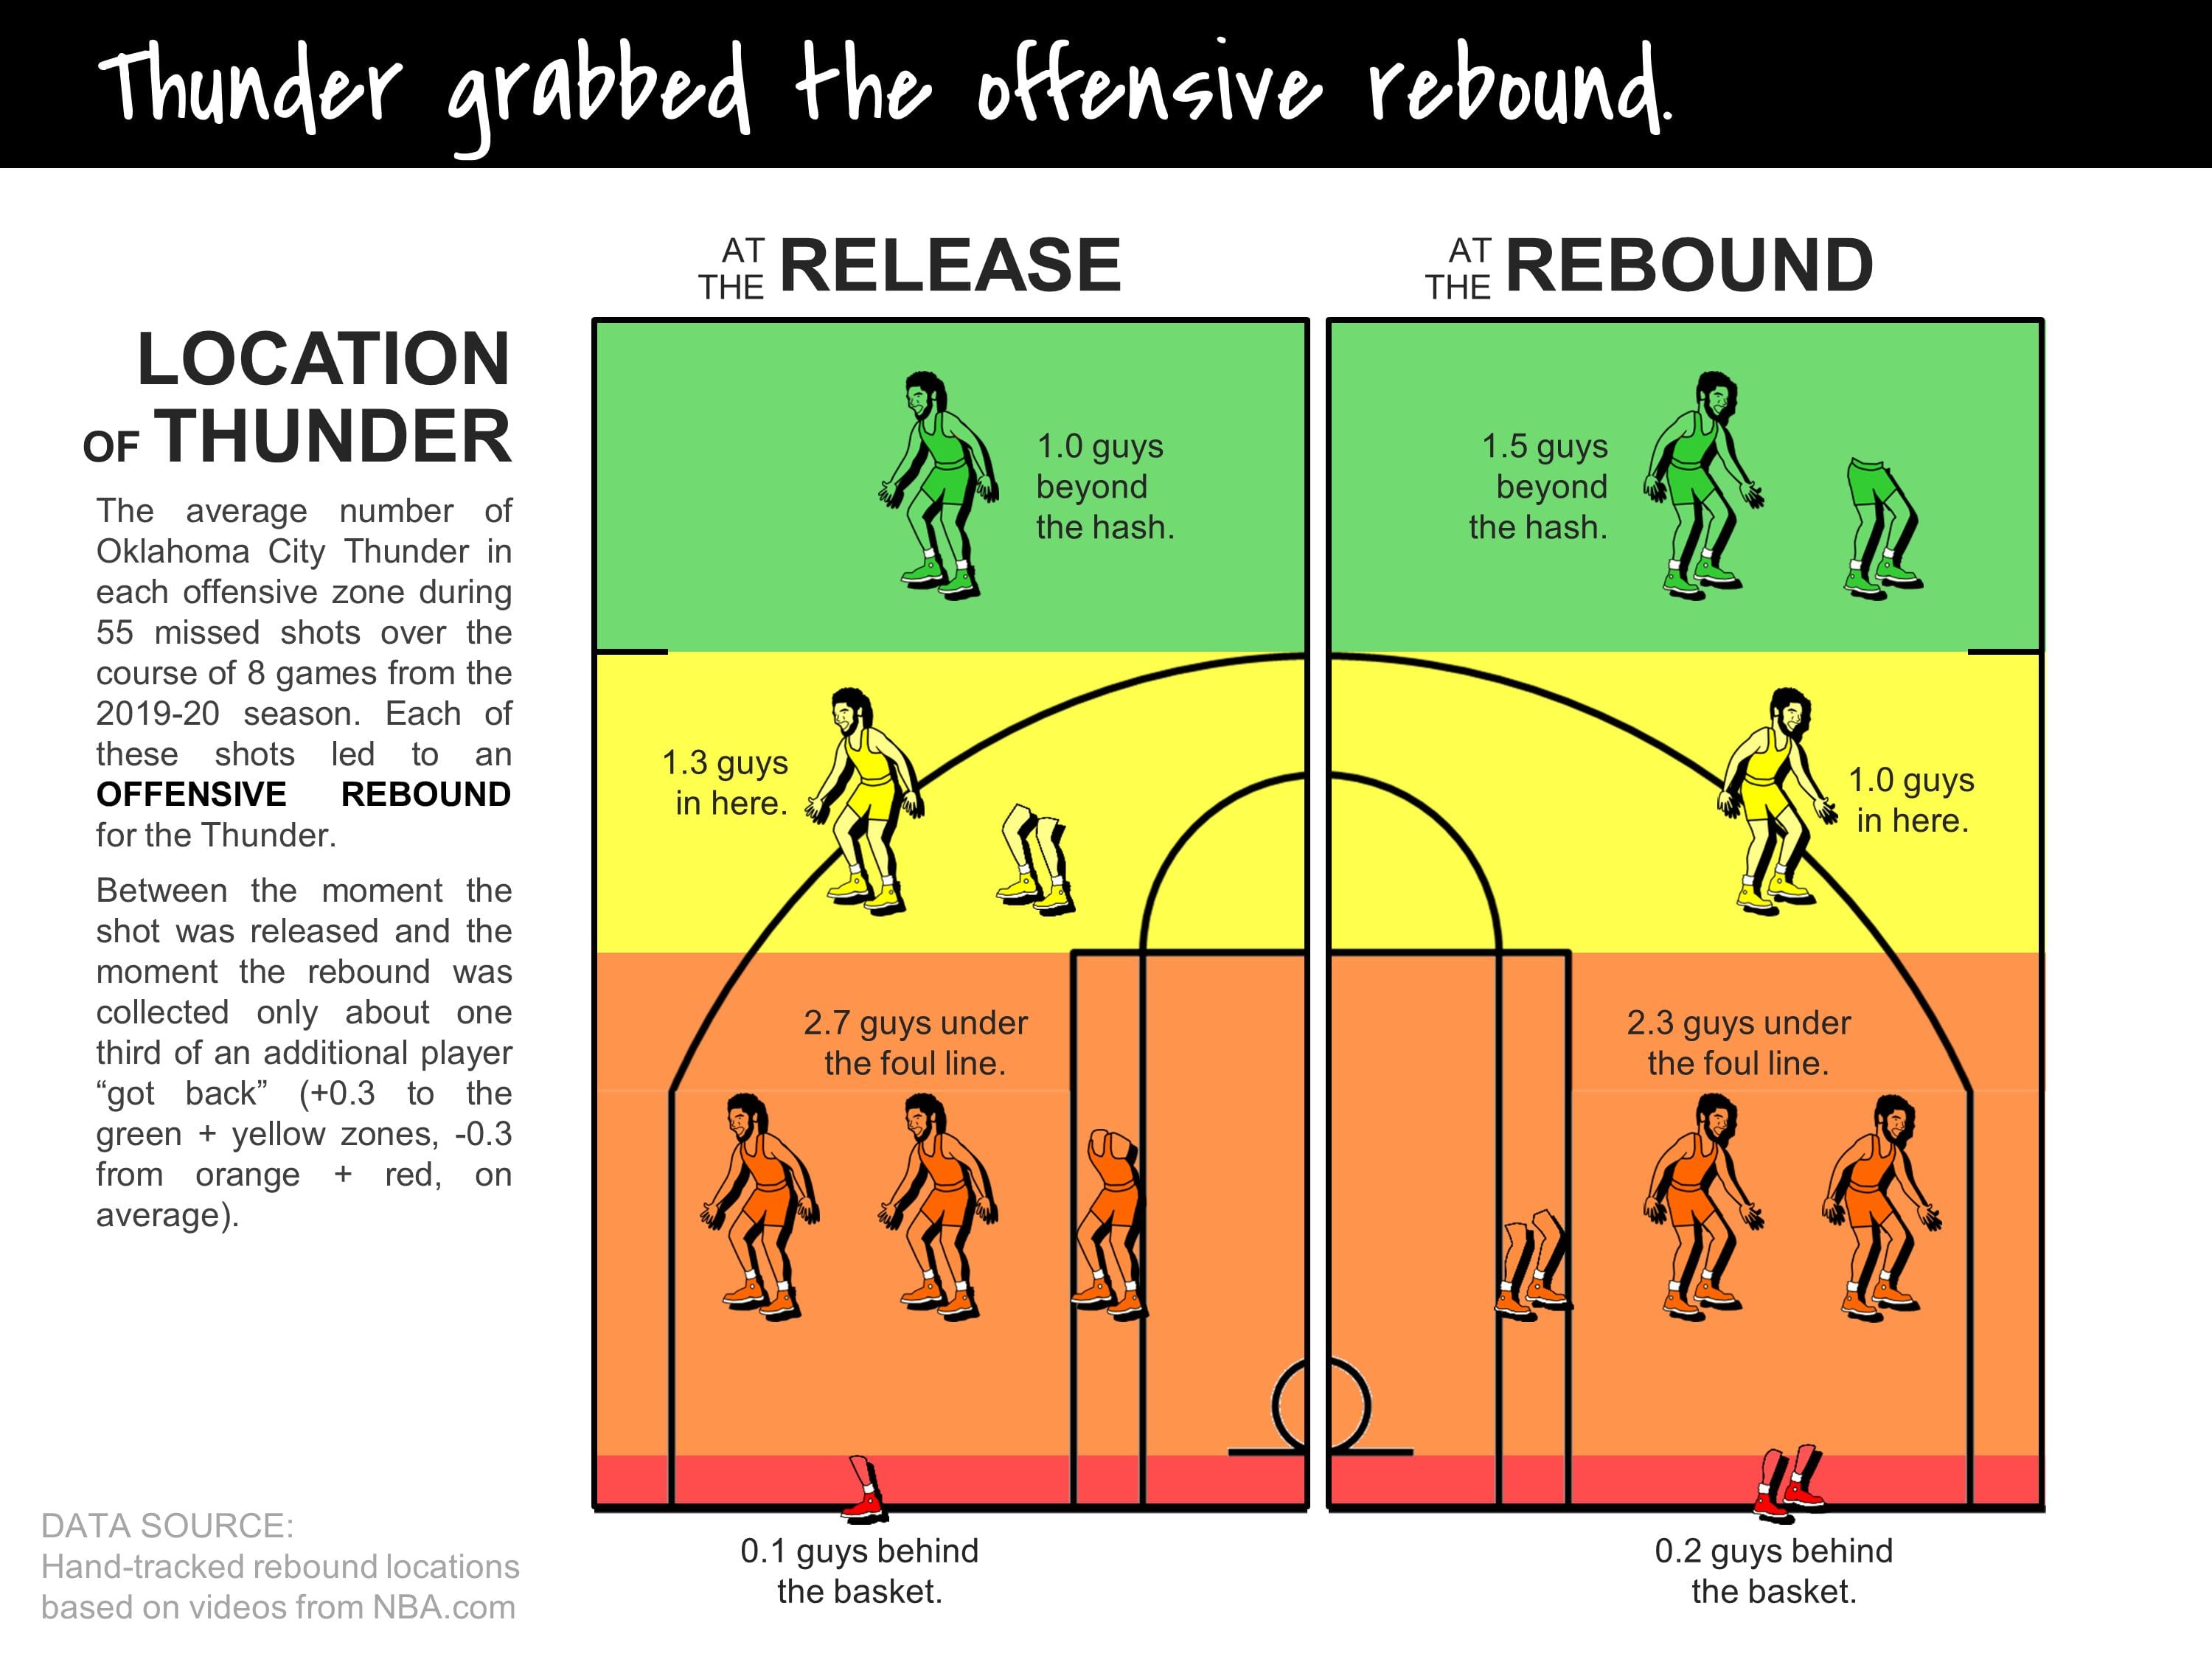
In an effort to find optimal strategies for offensive rebounding I took a closer look at what the Lakers and Thunder have been doing on the glass. I used PBPstats.com to catalog three types of rebounds: defensive rebounds that led to a half-court possession for the other team (ie. possession duration of 12 seconds or longer); defensive rebounds that led to a fast break for the other team (ie. possession duration of 6 seconds or less); or offensive rebounds. Next, I watched a bunch of rebound clips on NBA.com and hand-tracked the location of all ten players on the court at two points in time: (1) when the shot was released and (2) when the rebound was gathered. I collected a sample of rebounds from the 2019-20 season — breaking down eight games each for the Lakers and Thunder in their matchups against the Suns, Kings, Clippers, and Warriors (277 rebounds combined). To examine the amount of crashing or getting back being done in each scenario, I sorted player locations into four court sections: behind the backboard (red), under the foul line (orange), and inside (yellow) and outside (green) the hash marks. The charts below summarize what I found.
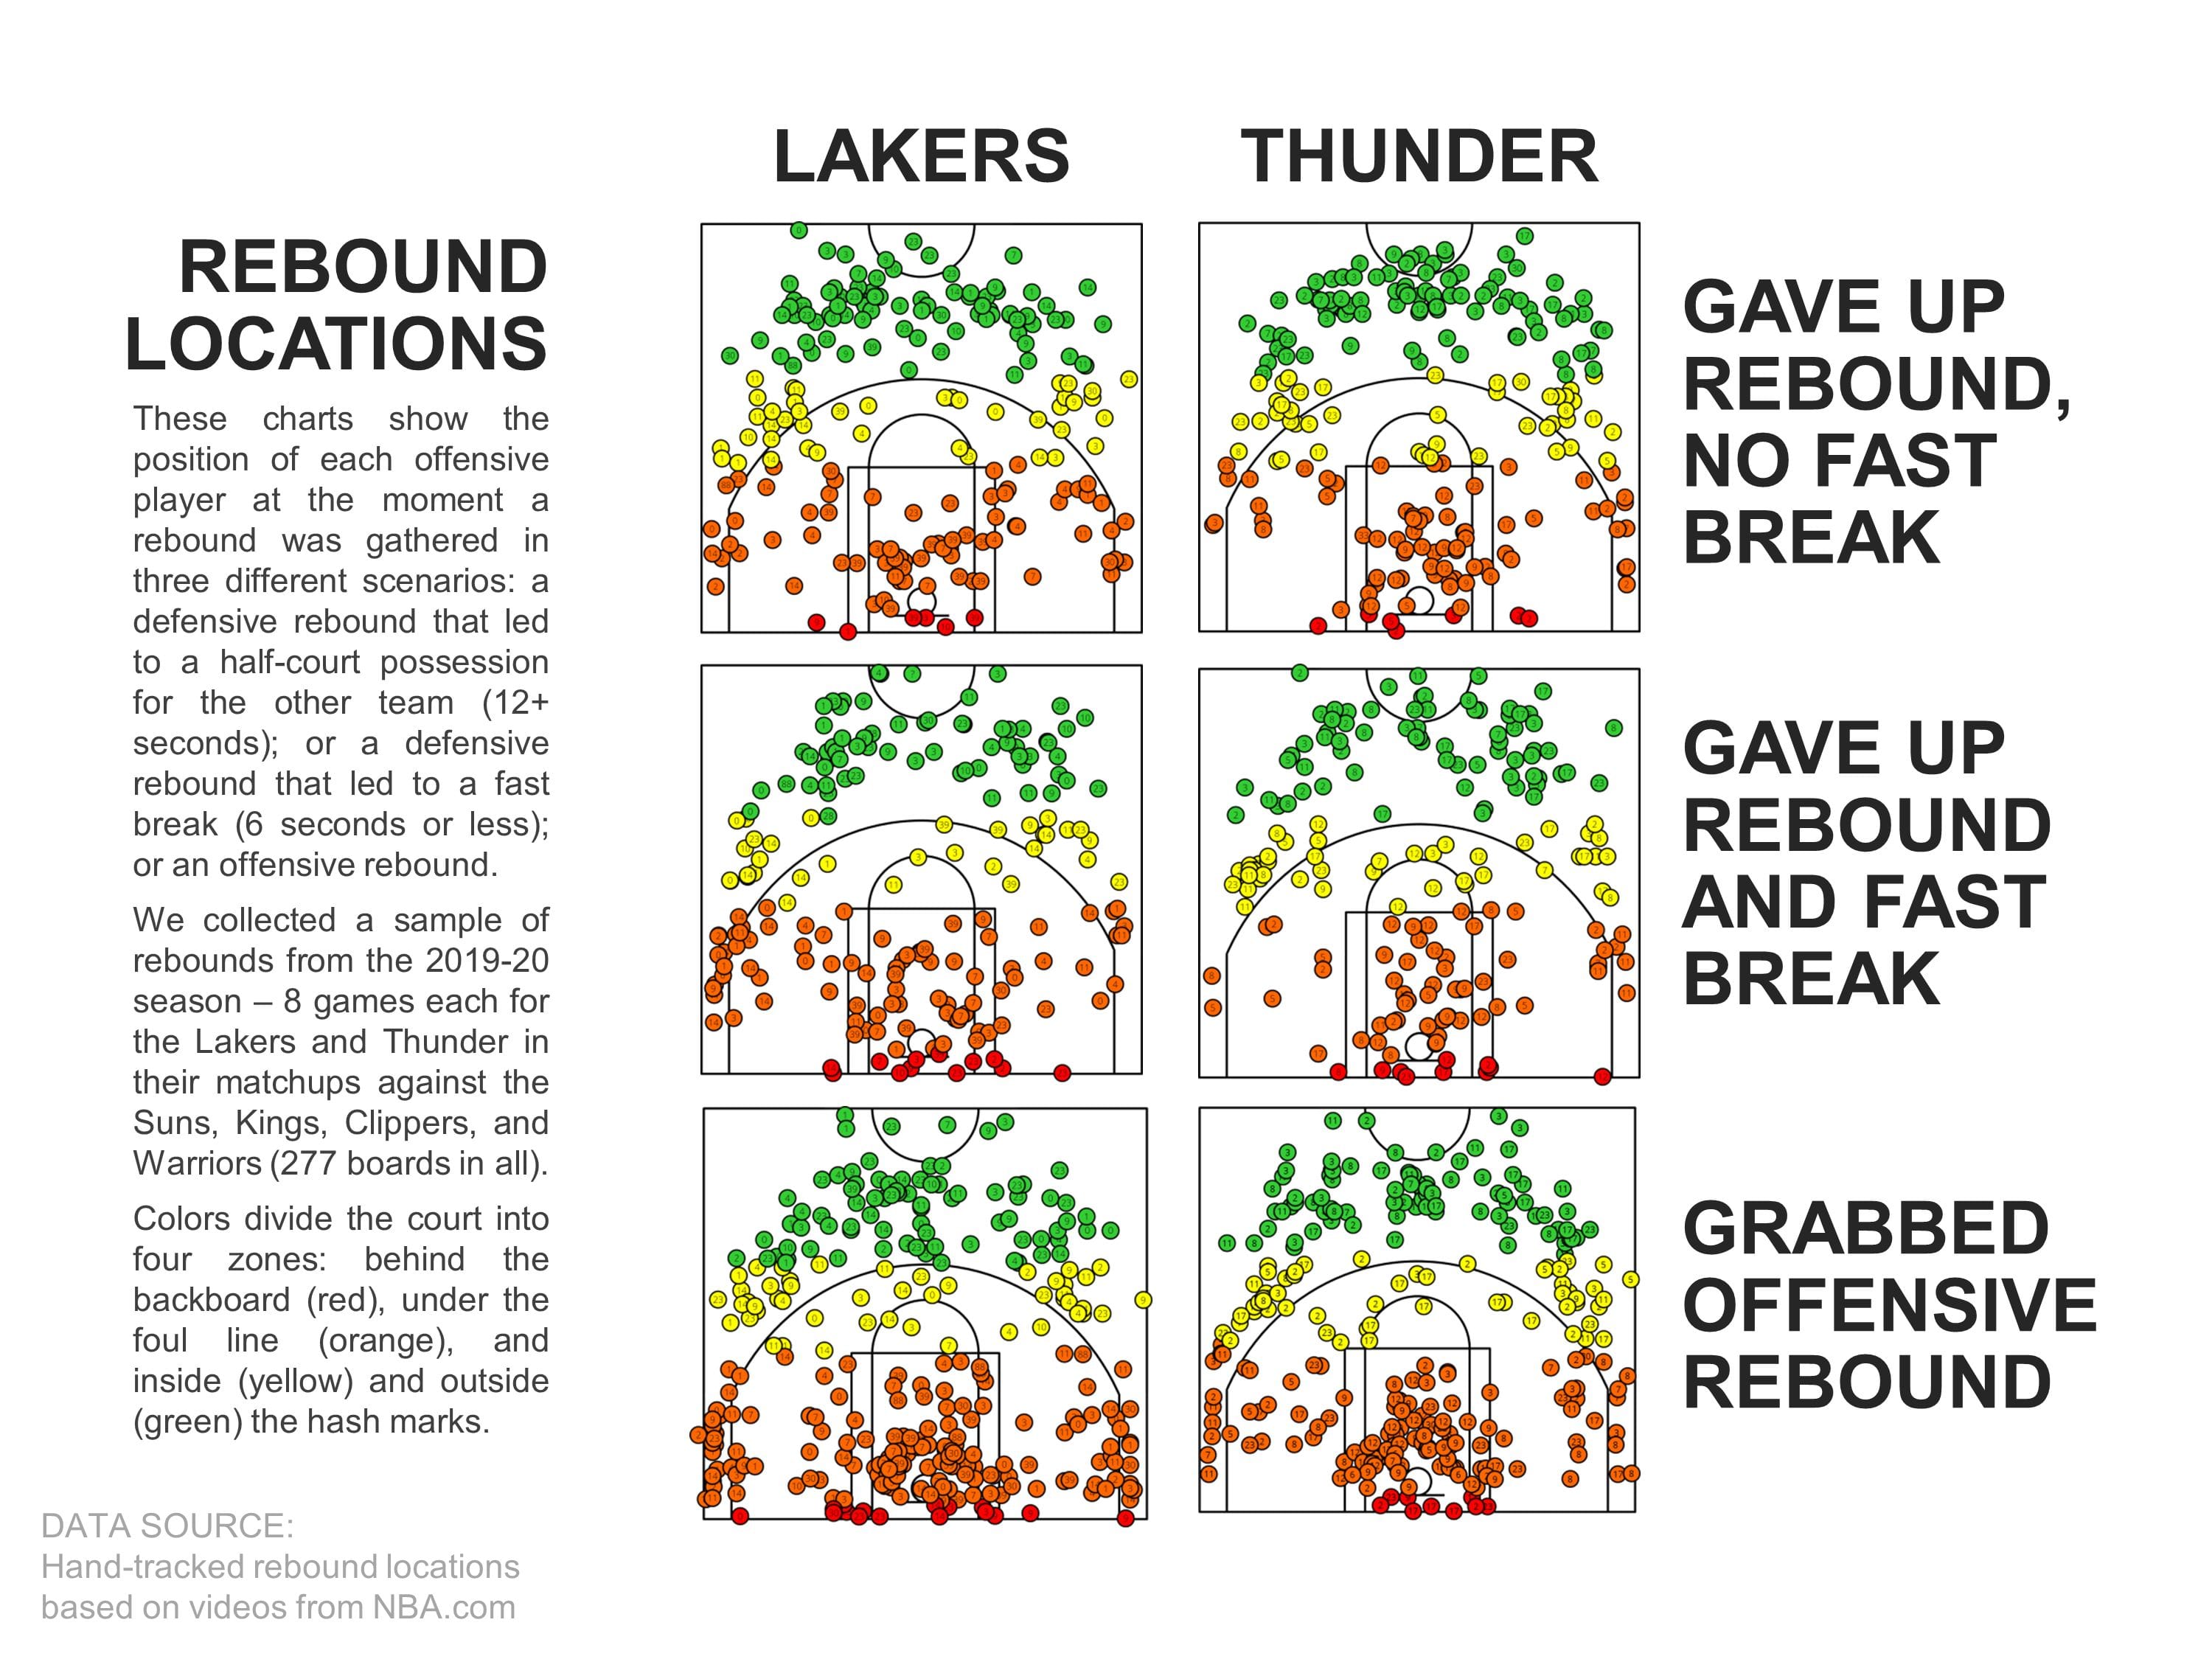
Can you spot any discrepancies between the three Laker panels (on the left) and the three Thunder panels (on the right)? I think the most obvious difference is that the Thunder have fewer orange dots in the corners of their charts because they do a more consistent job of withdrawing players from these spaces when a shot goes up. To highlight some of the more subtle differences between the rebounding strategies of the Lakers and the Thunder, the next six charts will focus on each of those six panels, one at time.
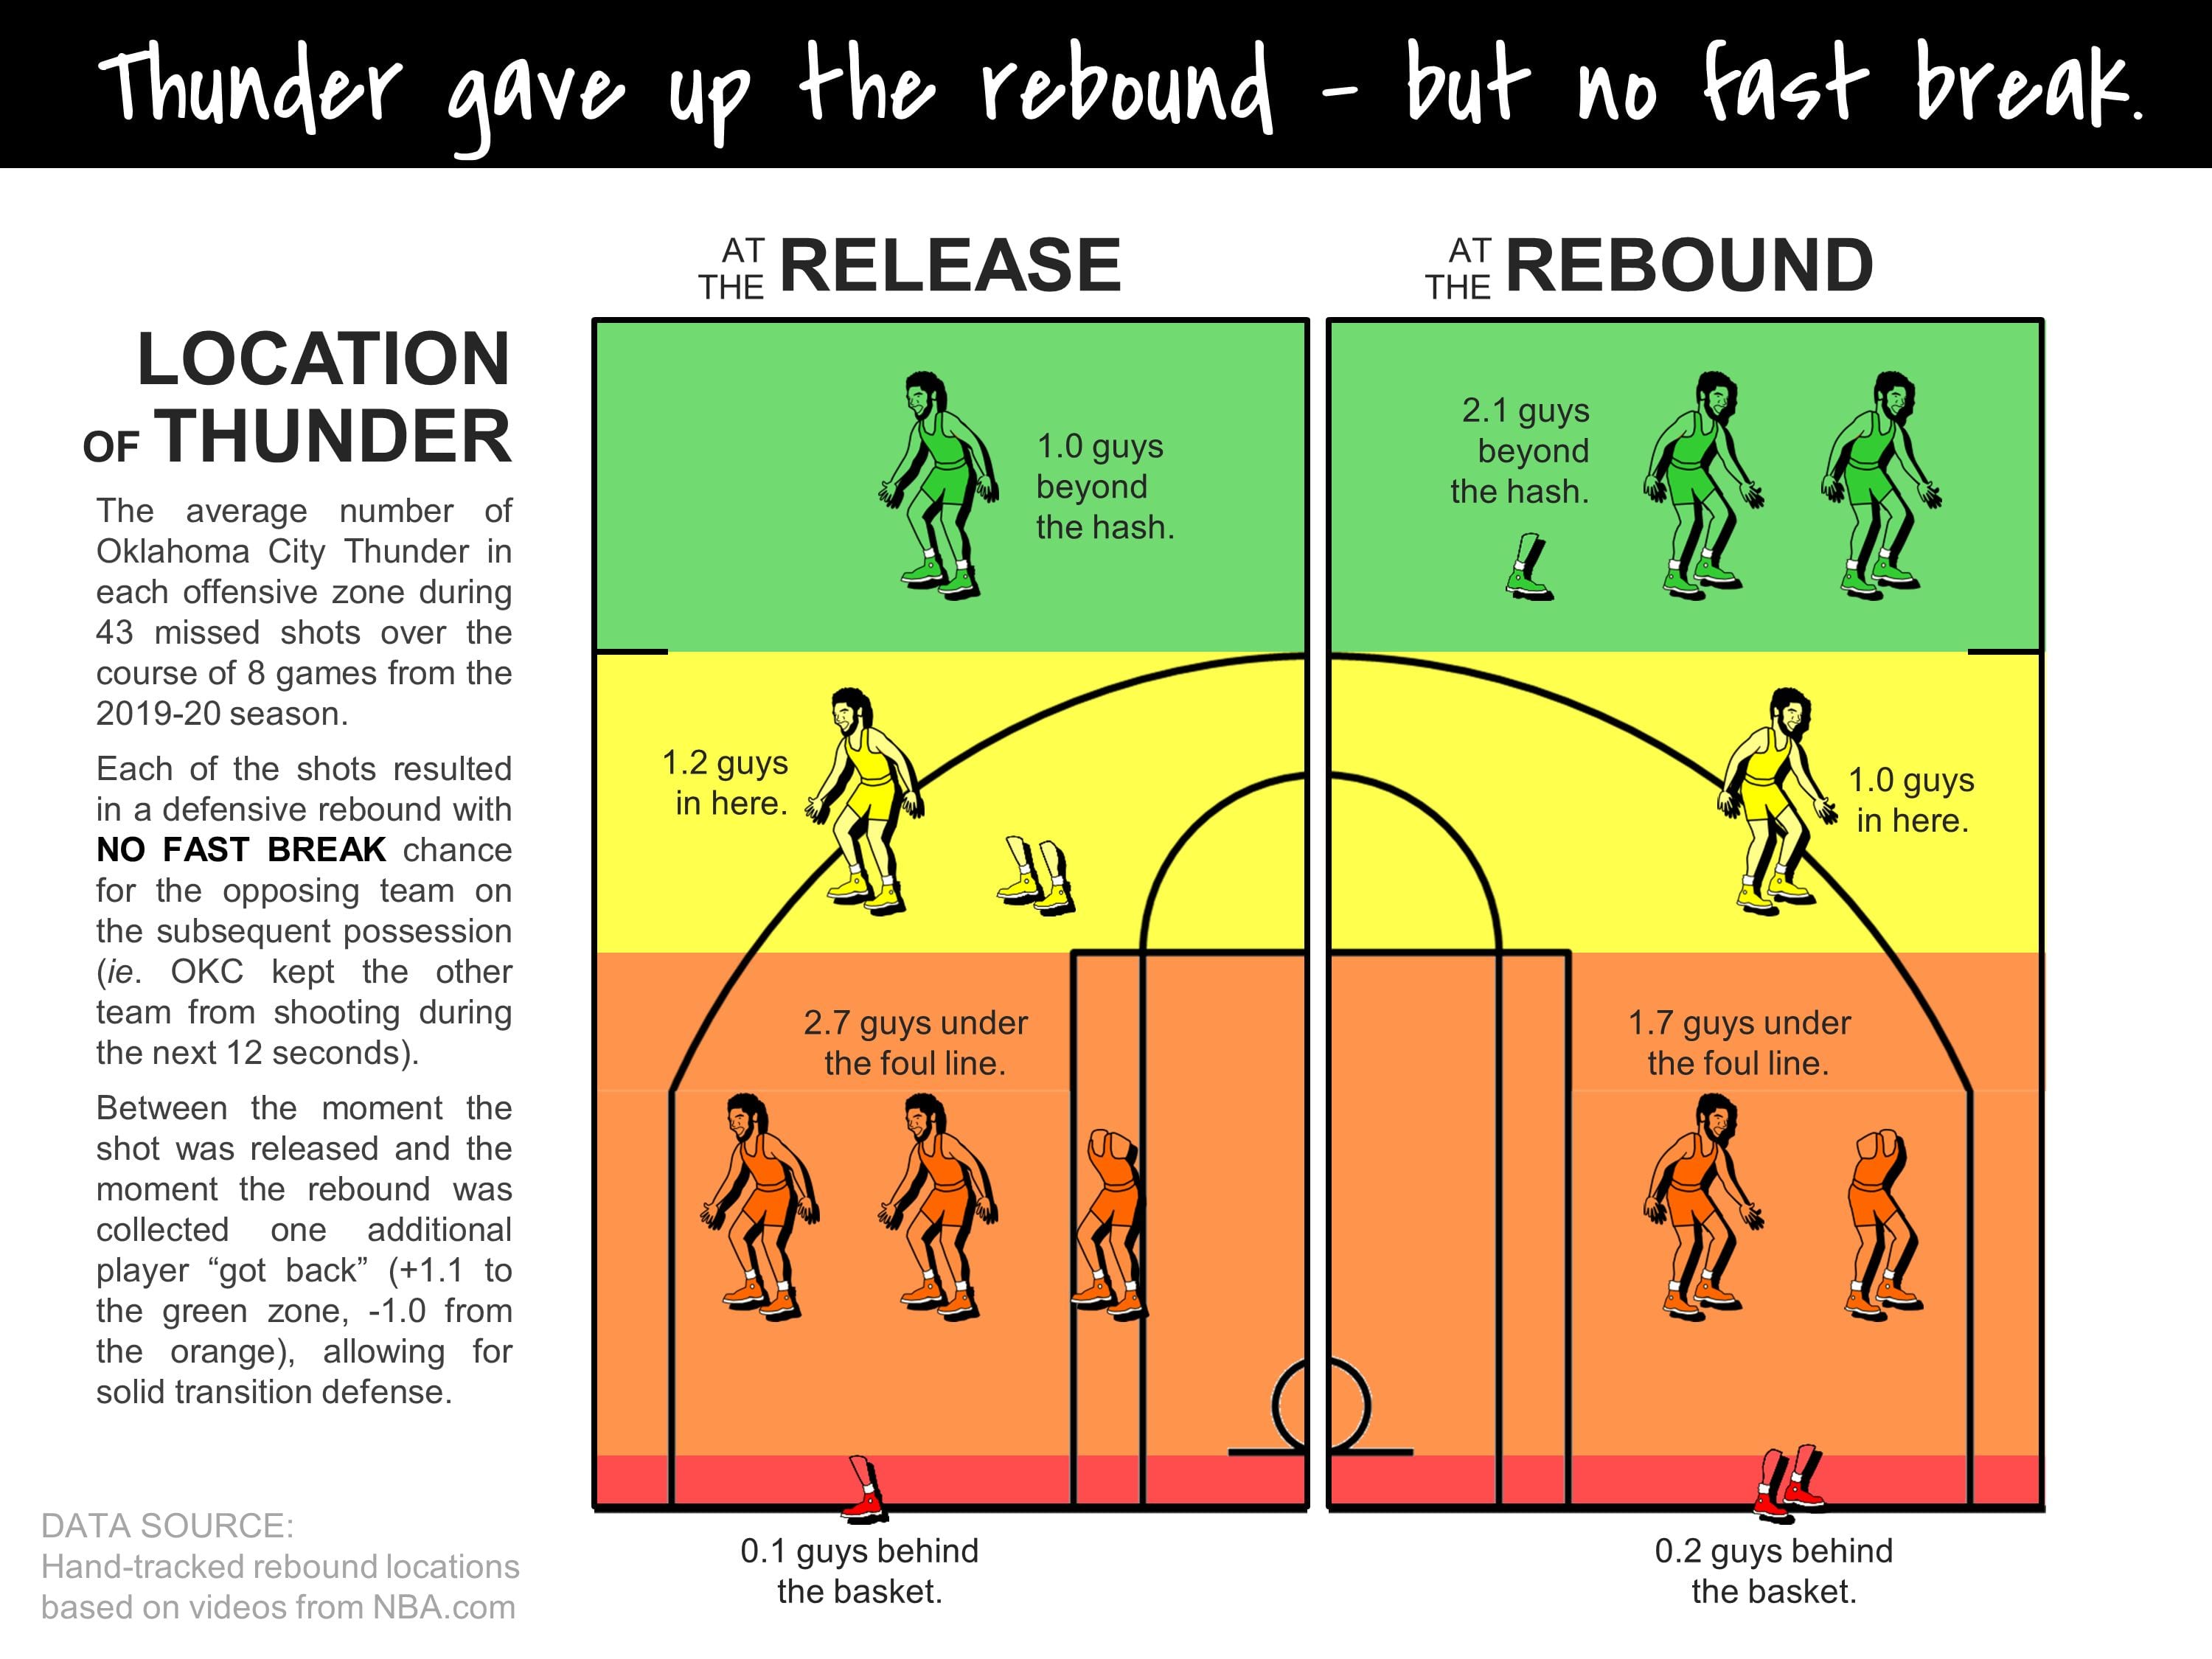
This first summary shows the average number of Lakers in each offensive zone in instances when a defensive rebound led to a half-court possession for the opposing team (ie. non-fast breaks). The left side of the chart shows Laker locations when the shot was released and the right side represents the moment when the rebound was collected. By comparing the flux of players between different color zones from release to rebound we can get a sense of how many players were getting back or crashing in these 41 instances when the Lakers played effective transition defense.
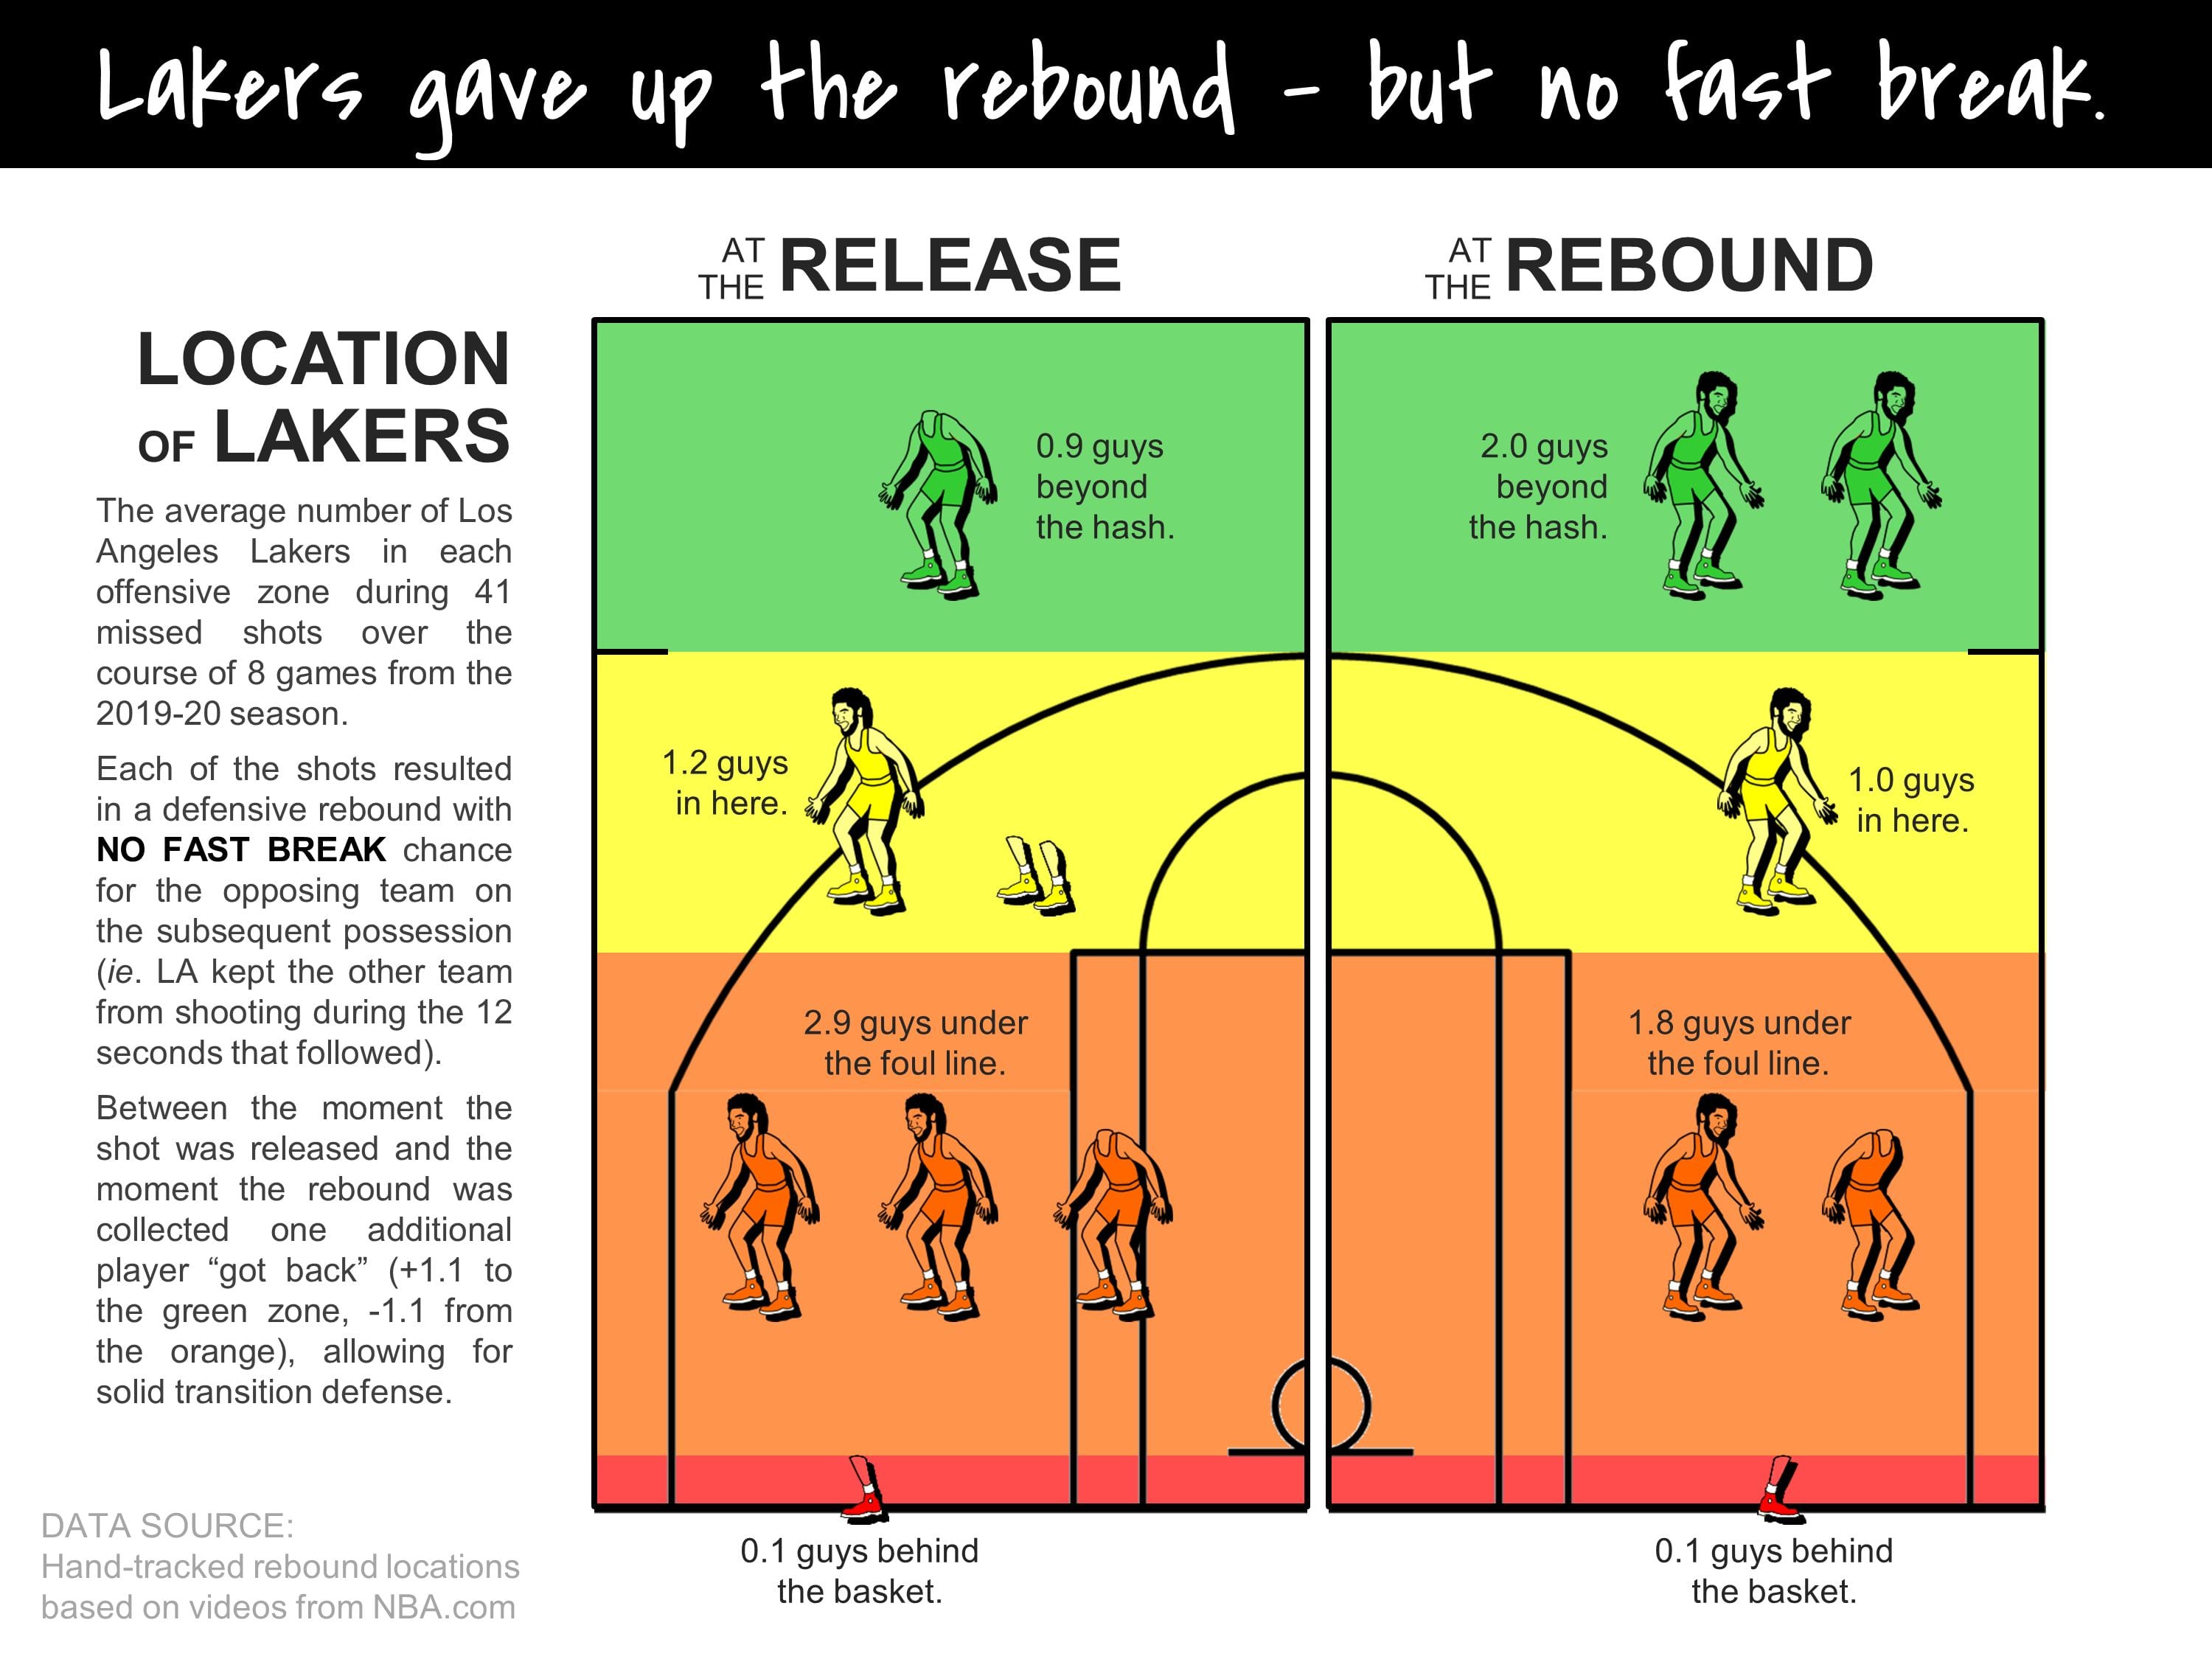
When the shot was released (shown on the left side of the chart), the Lakers tended to have one player standing in each of the green (0.9 players on average, to be exact) and yellow (1.2) zones with the other three players somewhere in the orange zone (2.9) or, much less frequently, in the red zone (0.1). During these plays that preceded good transition defense, by the time the other team was gathering the defensive rebound (shown on the right side of the chart), the Lakers had two players back in the green zone (2.0) and two left in the orange zone (1.8), which we could interpret as being the equivalent of one player getting all the way back (for example: if one guy moved from the orange to the yellow zone and another guy moved from the yellow to the green zone).
Let’s compare this to what the Thunder did in similar situations when they missed shots that led to successful transition defense.
In these instances when the offense gave up the rebound but not the fast break, the Thunder chart and the Lakers chart look very similar. That is, both teams adopted a conservative approach at times and getting extra men back often led to successful transition defense. However, there were other times when the teams had divergent approaches to rebounding.
The chart below shows the location of the Lakers on missed shots that resulted in a defensive rebound which started a fast break for the other team.
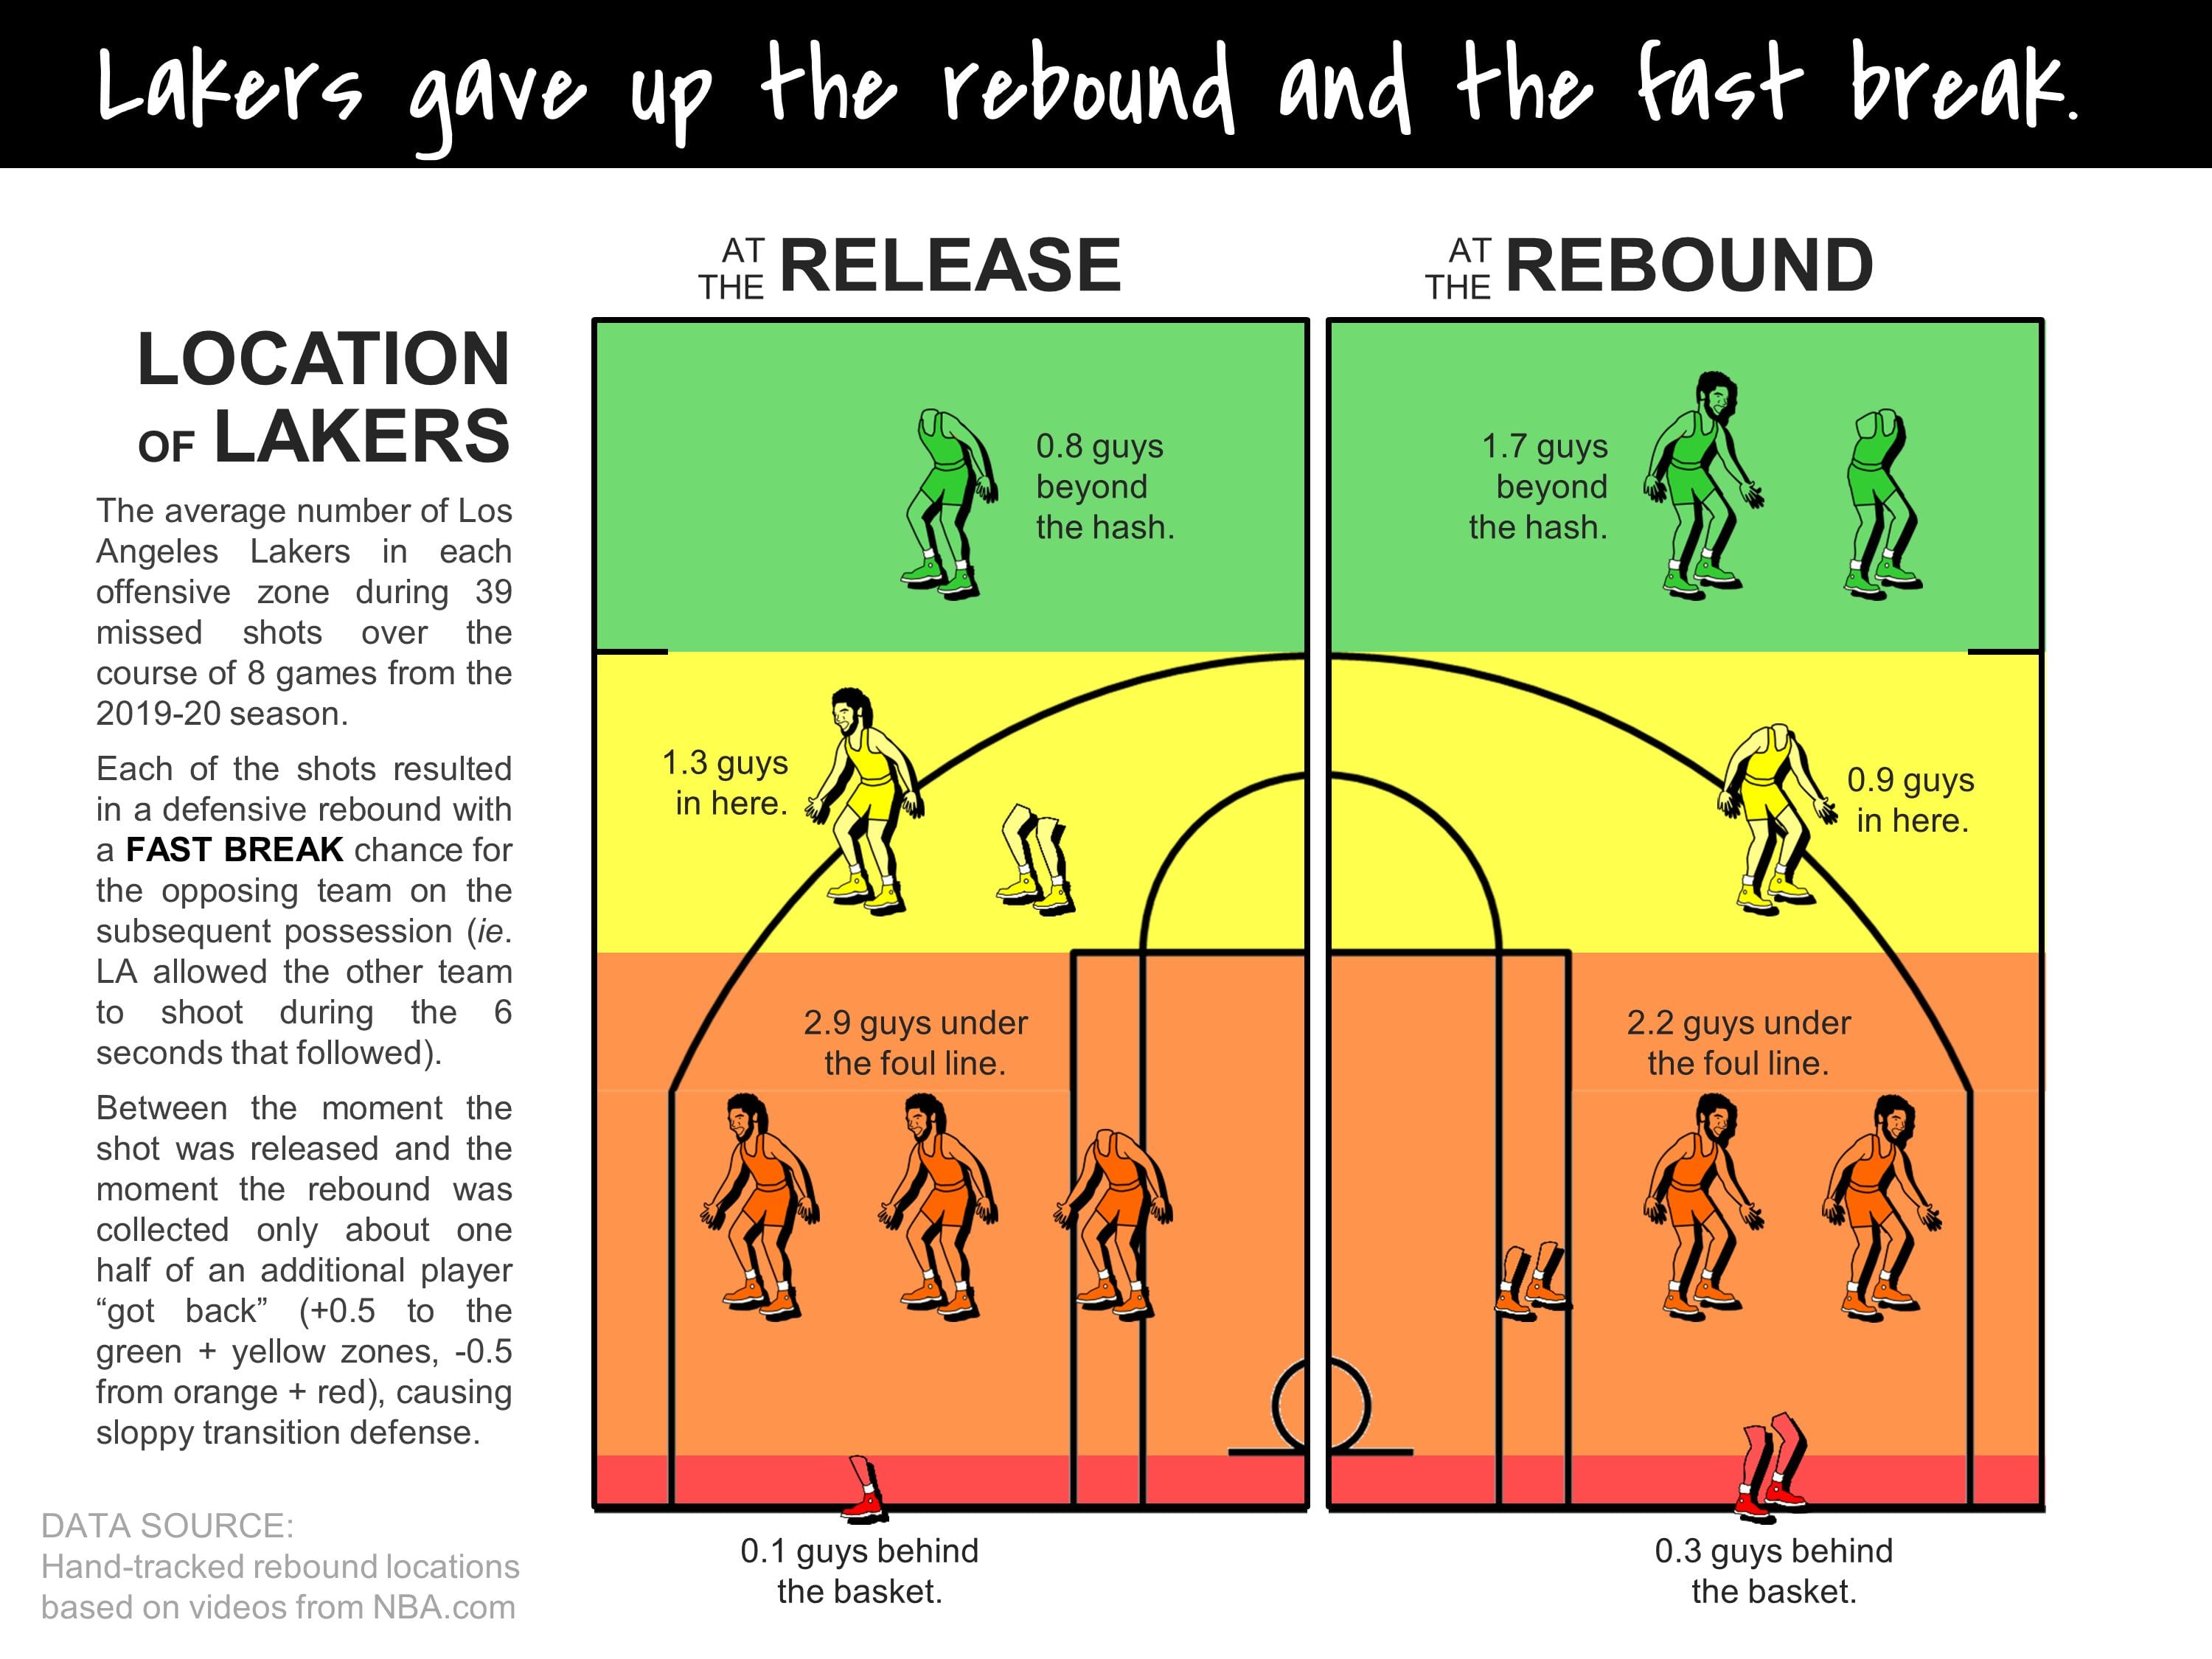
The left side of the chart is nearly identical to the first Laker chart (0.8 in green, 1.3 in yellow, 2.9 in orange, 0.1 in red). In other words, the Lakers had the same number of players in each zone at the time the shot was released whether or not they subsequently gave up a fast break. From the moment the shot was released to the moment it was rebounded, the Lakers were +0.5 players in the green and yellow zones combined and -0.5 from the orange and red zones combined. That’s about half as much retreating as they achieved in situations when they prevented fast breaks. The implication is that the Lakers occasionally used a more aggressive offensive rebounding strategy which had the tendency to result in them giving up fast breaks.
Now let’s look at the plays where the Thunder lost the rebound and then gave up a quick shot in transition.
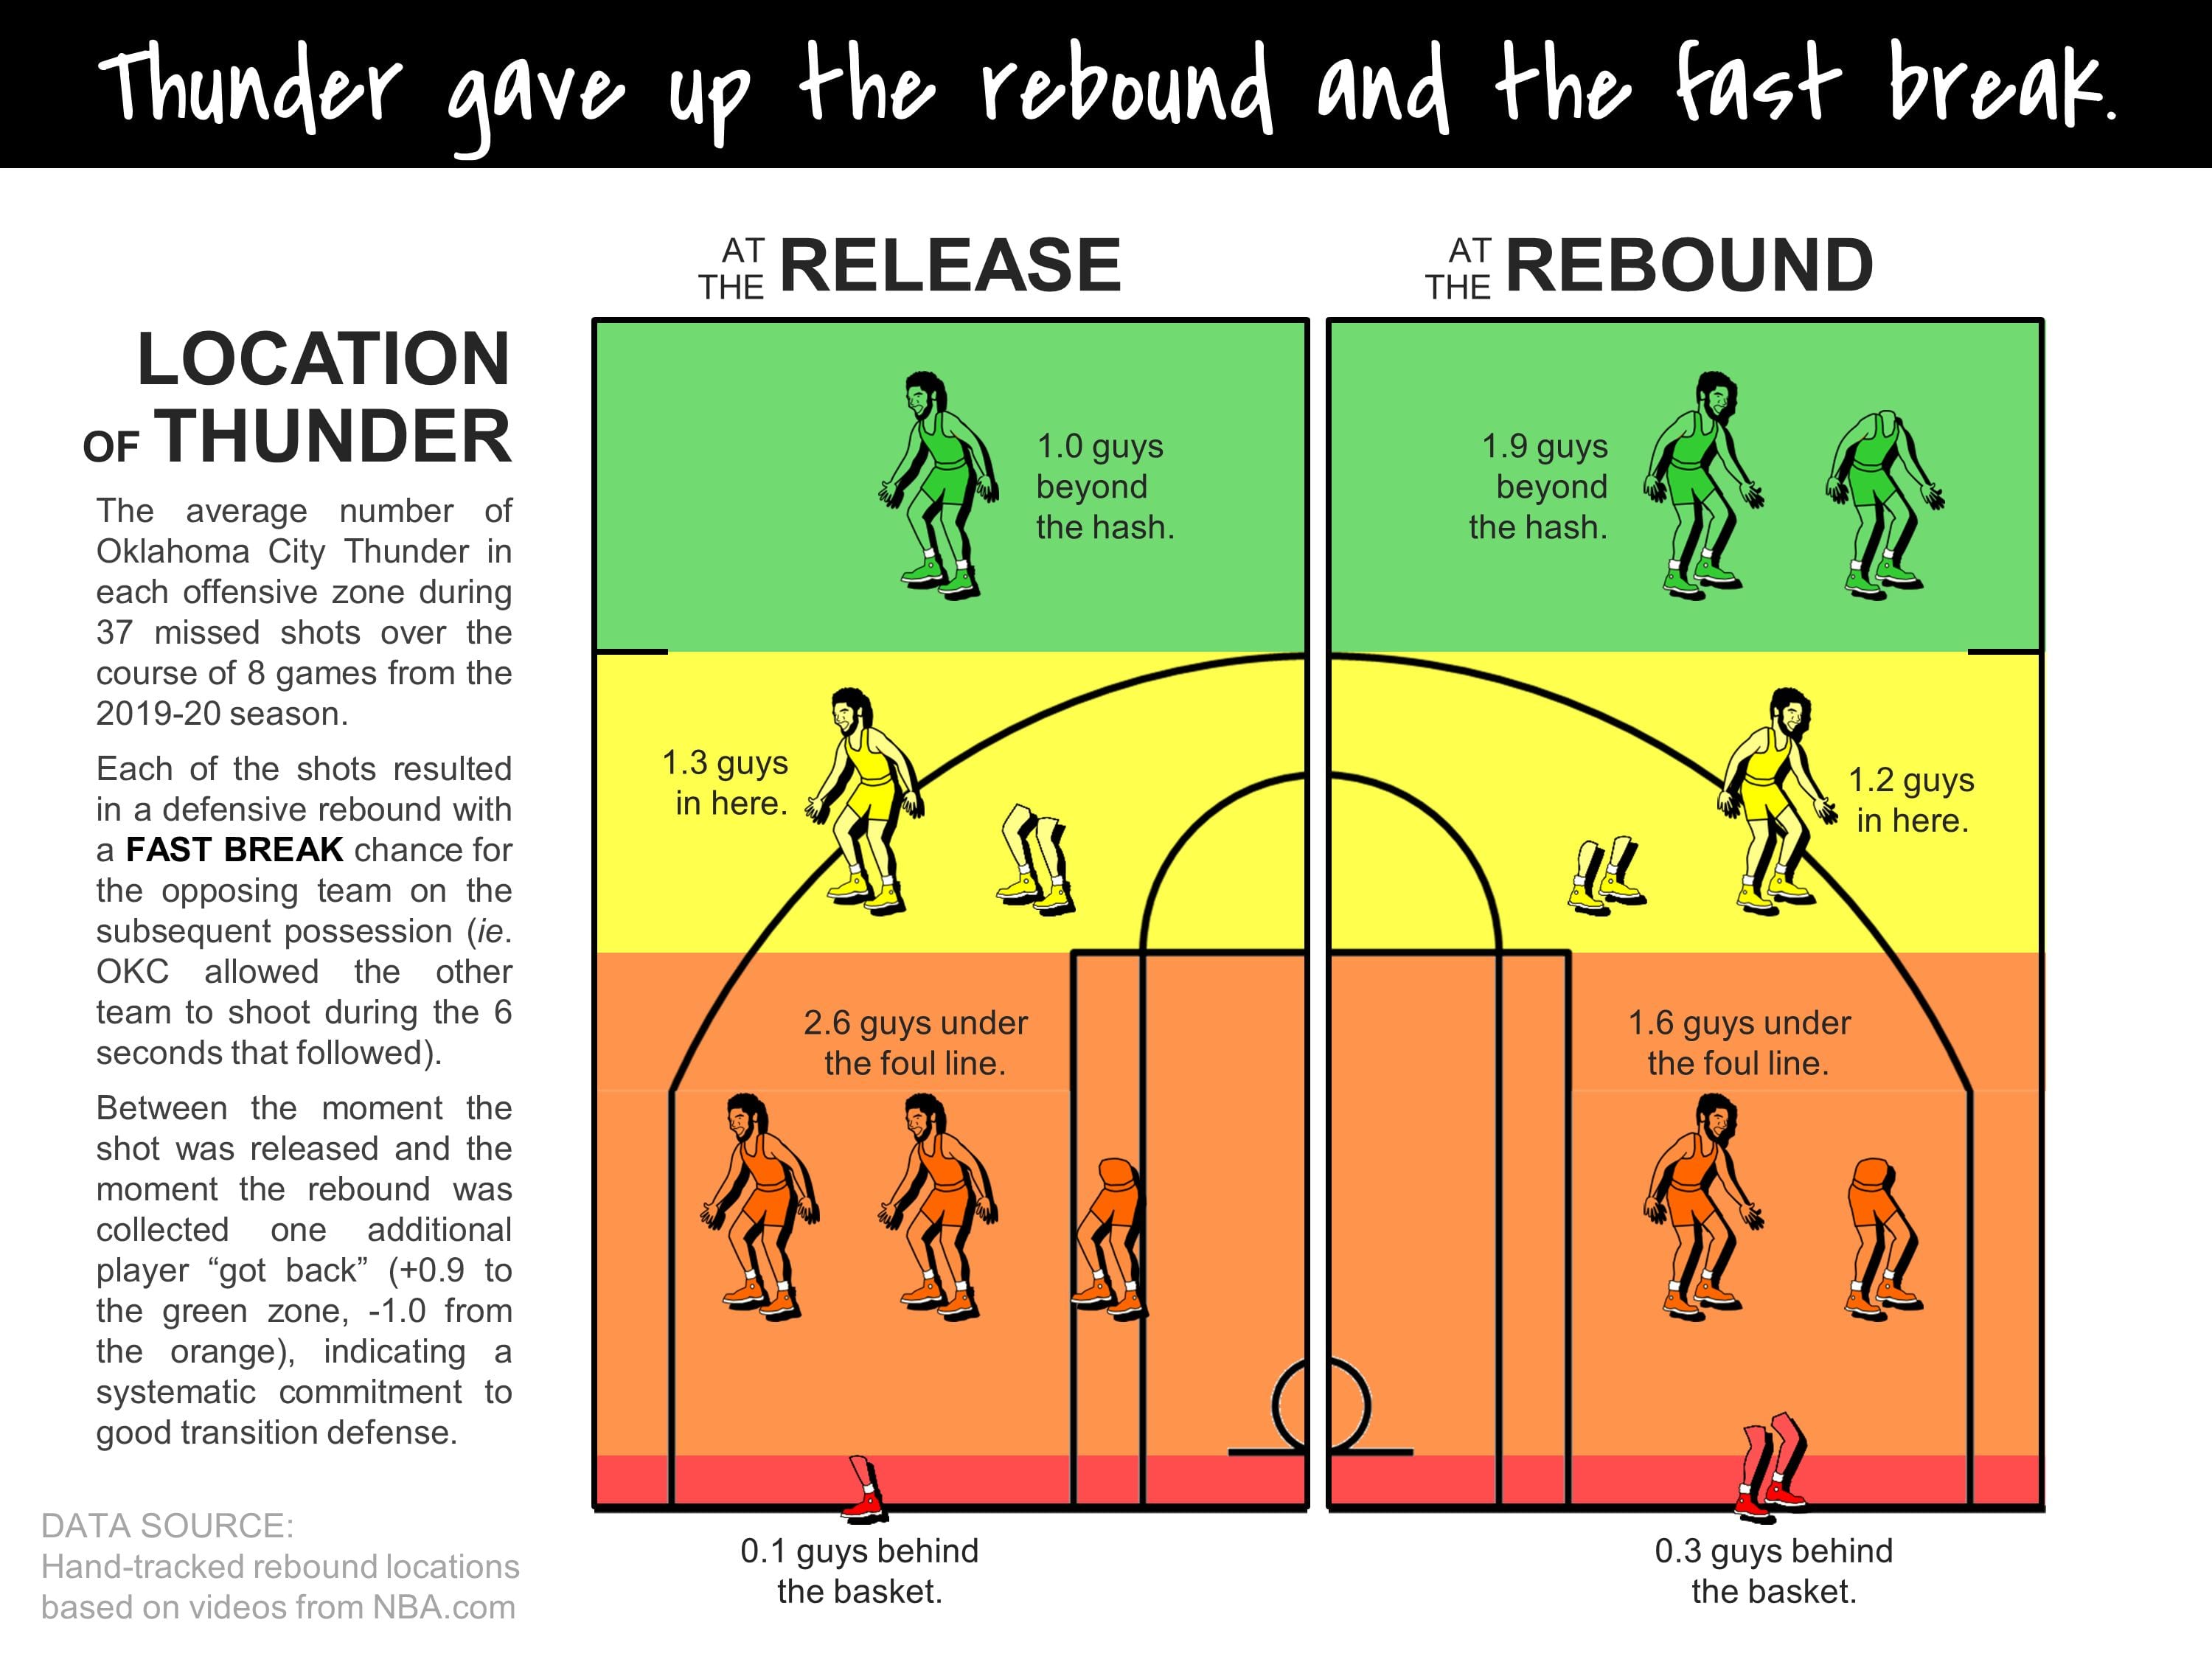
Like the Lakers, the Thunder had the same number of players in each zone at the time the shot was released whether or not they subsequently gave up a fast break (i.e., the left side of this chart matches the left side of the first Thunder chart). Unlike the Lakers, however, the Thunder ALSO had the same number of players in each zone at the time the shot was REBOUNDED whether or not they subsequently gave up a fast break (i.e. the right side of this chart also matches the right side of the first Thunder chart). On plays when the Thunder gave up a fast break, from the moment the shot was released to the moment it was rebounded, they were +1.0 players in the green zone and -1.0 from the orange zone. In other words, the Thunder consistently got back on defense, even when they failed to stop the fast break.
So what happened in these 37 instances? Why did the Thunder continue to give up transition chances if they were getting back consistently?
One reason can be found in the red zone. Between the shot and the rebound, both the Thunder and the Lakers went from having 0.1 to 0.3 players standing behind the basket. These red-zone plays were mostly the result of a shooter attacking the basket and being carried out of bounds by contact or by his own momentum. Players sometimes fell down on these plays. Offensive rebounders ended up on the ground in other circumstances, too. These situations are killers for transition defense because they tend to lead to immediate 5-on-4 advantages.
Sometimes the Thunder (or the Lakers) started with conservative positioning at the moment of the rebound but an aggressive decision — like Chris Paul gambling for a steal in the backcourt — subsequently gave the other team a numerical advantage. Sometimes there was no numerical advantage surrendered at all. I tried to filter out plays where time and score would have dictated a short (or long) possession for the opposing team, but sometimes Steph Curry just jacks up a 30-footer with 20 seconds left on the shot clock. A short defensive possession is not necessarily synonymous with bad transition defense.
And sometimes, even for the uber-conservative Thunder, an offensive rebounding chance was just too juicy to pass up. A loose ball tipped in the air by Steven Adams might entice an Oklahoma City wing or two to deviate from his normal evacuation route in an effort to keep possession.
The next chart shows the average number of Lakers in each zone on plays when they grabbed an offensive rebound.
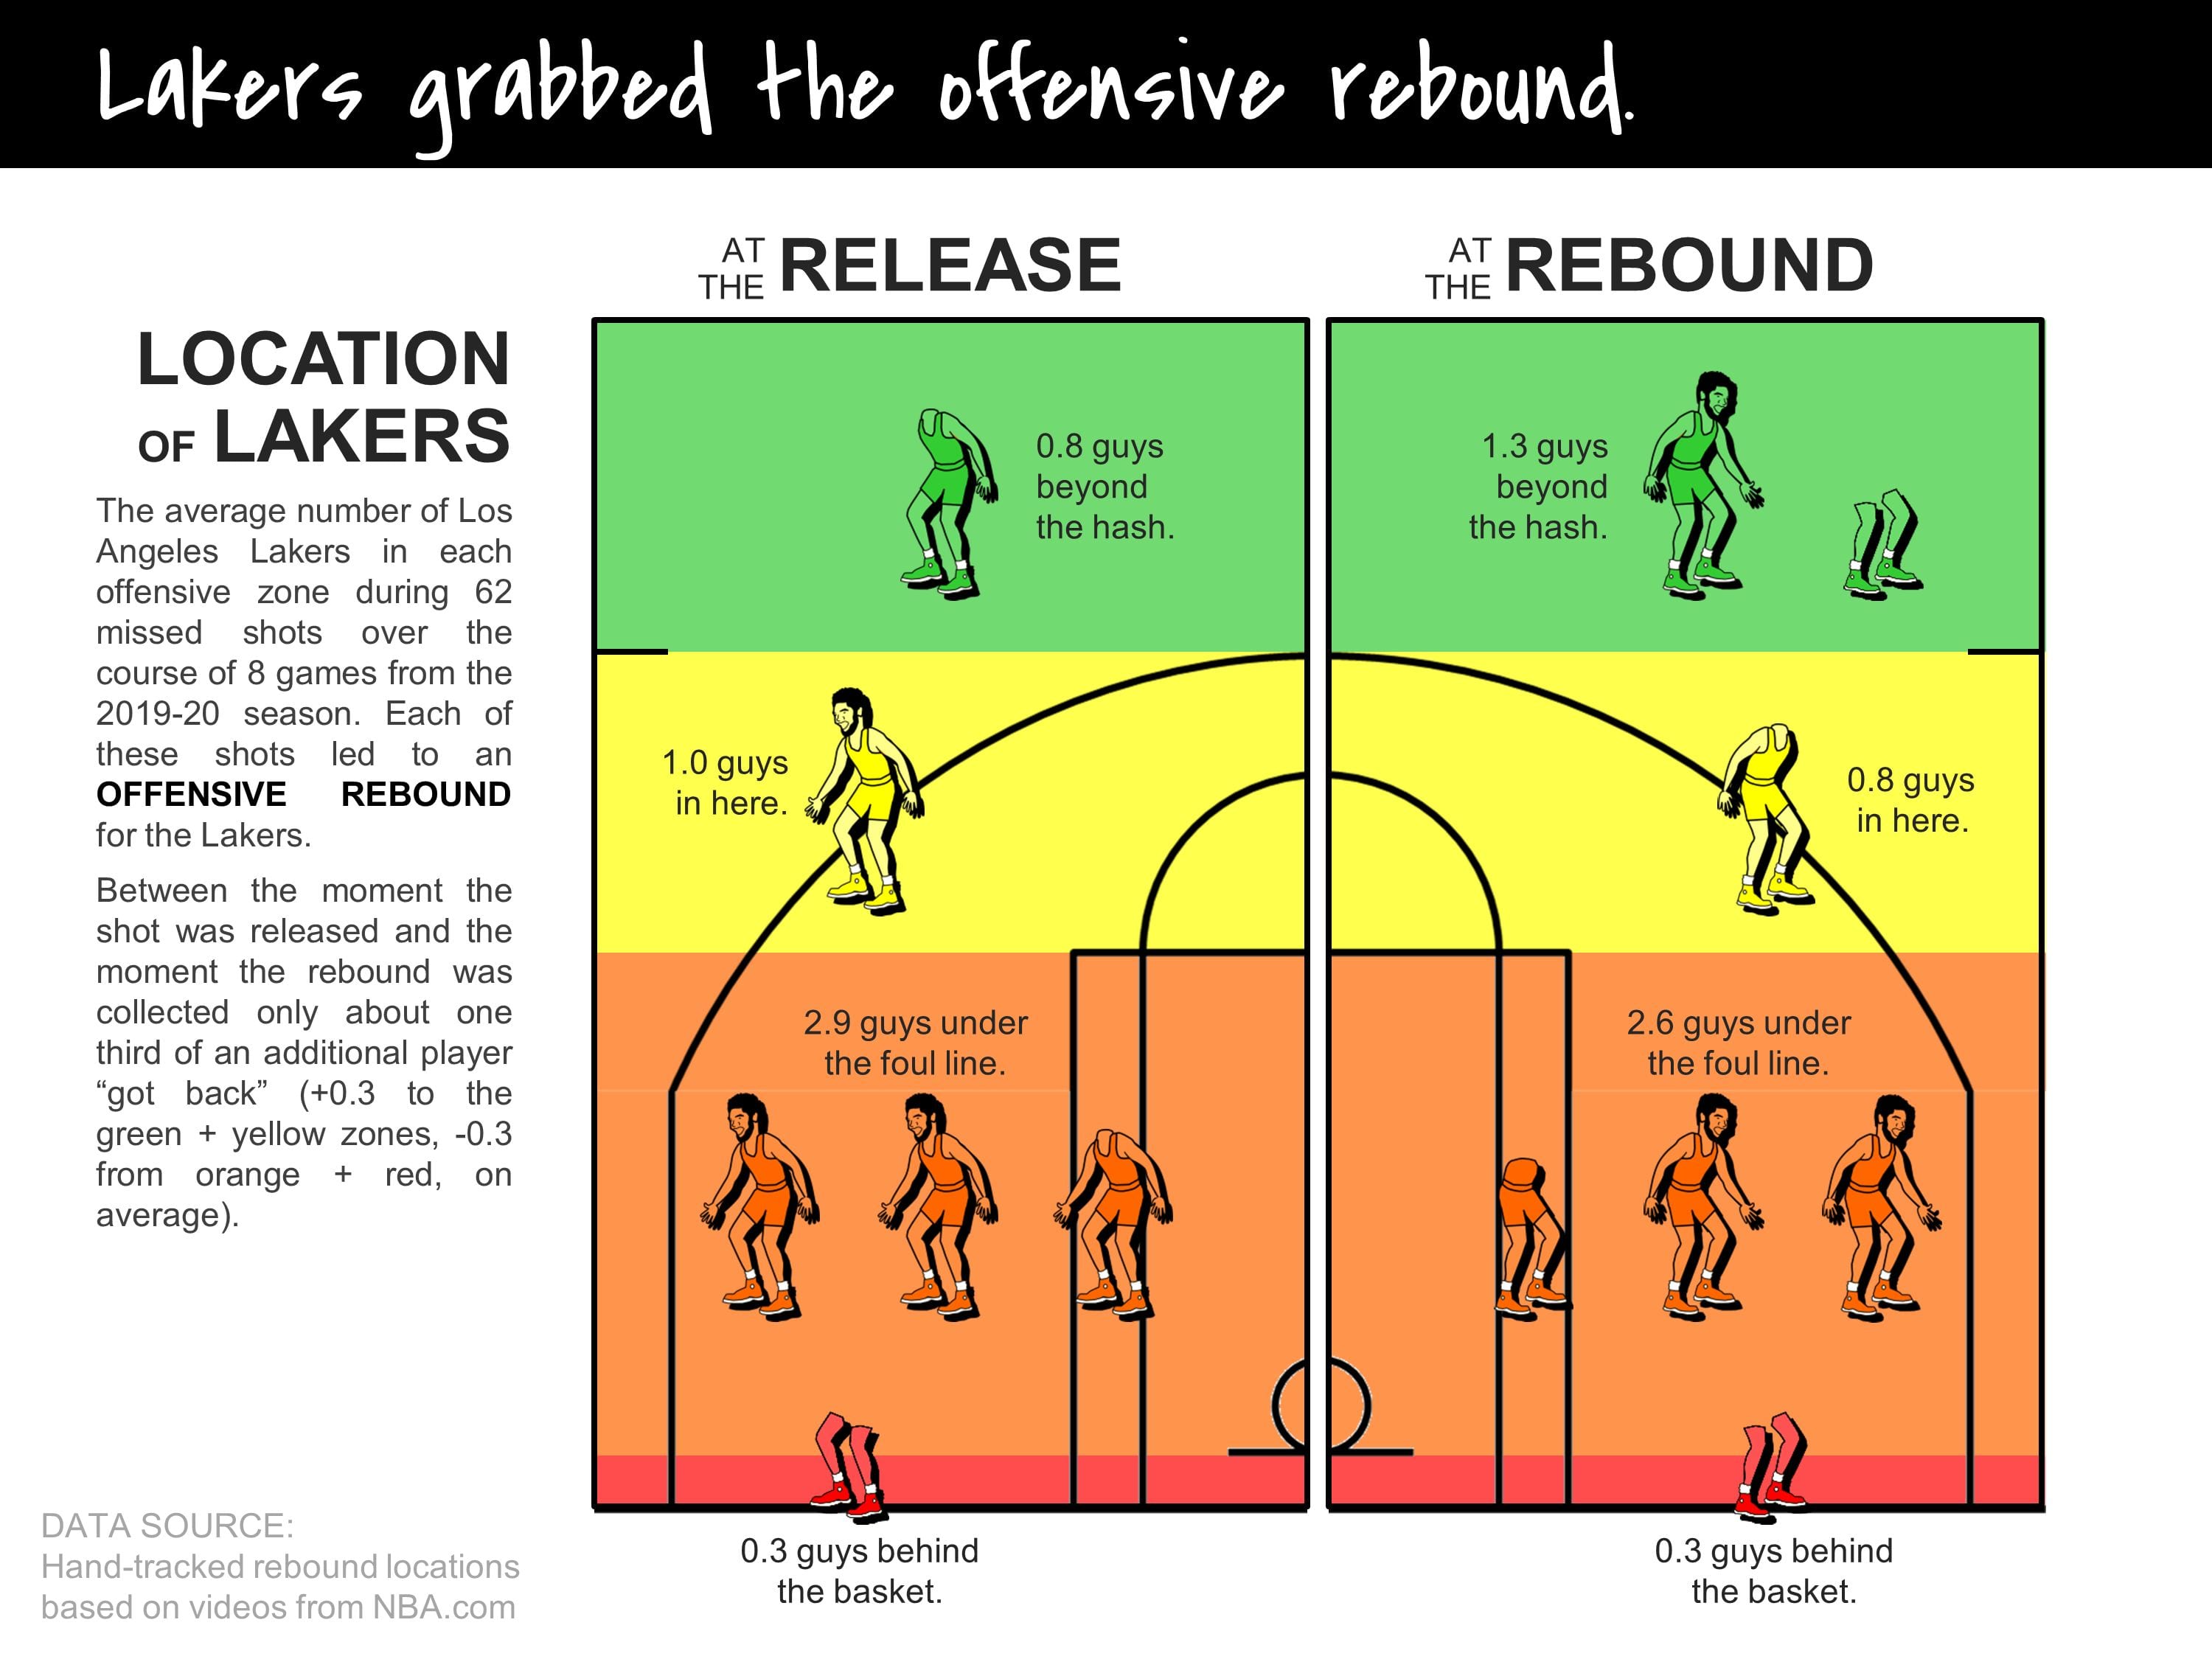
Again the left side of the chart (at the release), is similar to the two previous charts that showed the Lakers positioning before giving up defensive rebounds. One exception was that there were more players in the red zone at the moment the shot was taken on the plays where the Lakers got an offensive rebound than on the plays where they gave up a defensive rebound. These were usually players who were running the baseline from one corner to the other or players who had driven to the basket and made a kick-out pass to a perimeter teammate. In both examples, having extra bodies around the basket led to opportunistic offensive rebounding. I excluded plays where a shooter rebounded his own miss in my analysis, which would have added even more players to the orange and red zones.
Compared to the other two Lakers charts, the offensive rebound chart shows the least amount of movement away from the basket between the moment when the shot was taken and the moment when the rebound was gathered (+0.3 to the green and yellow zones combined, -0.3 from the orange and red zones combined). This implies that crashing (or, at least, not getting back immediately) was helpful in collecting offensive boards.
Interestingly, the Thunder had the same number of players in each zone when the shot was released whether or not they subsequently grabbed the offensive rebound. That’s different from the pattern we saw for the Lakers who tended to have more players around the basket prior to offensive rebounds. My hypothesis is that the difference is explained by the fact that the Thunder have shorter drive-and-kick players. When LeBron passes the ball out to a shooter and stays in the lane to rebound, he can muscle people out of his way under the basket. The Thunder distributors — Chris Paul, Shai Gilgeous-Alexander, and Dennis Schroder — are smaller and less formidable offensive rebounders.
On offensive rebound plays, once the shot was in the air, the Thunder had a similar pattern of movement as the Lakers (+0.3 to the green and yellow zones combined, -0.3 from the orange and red zones combined). Again, this implies that some selective crashing was useful.
This accounting of the average number of players in each zone is interesting, but it’s a bit abstract. How the heck is 30 percent of a player going to grab a rebound? So let’s consider some more tangible summaries of the data and see if we can come up with a few guidelines that a coach or player might find actionable.
How often did each team have three players in the green zone at the moment the ball was rebounded? How much did having three players in the green zone decrease a team’s odds of giving up a fast break?
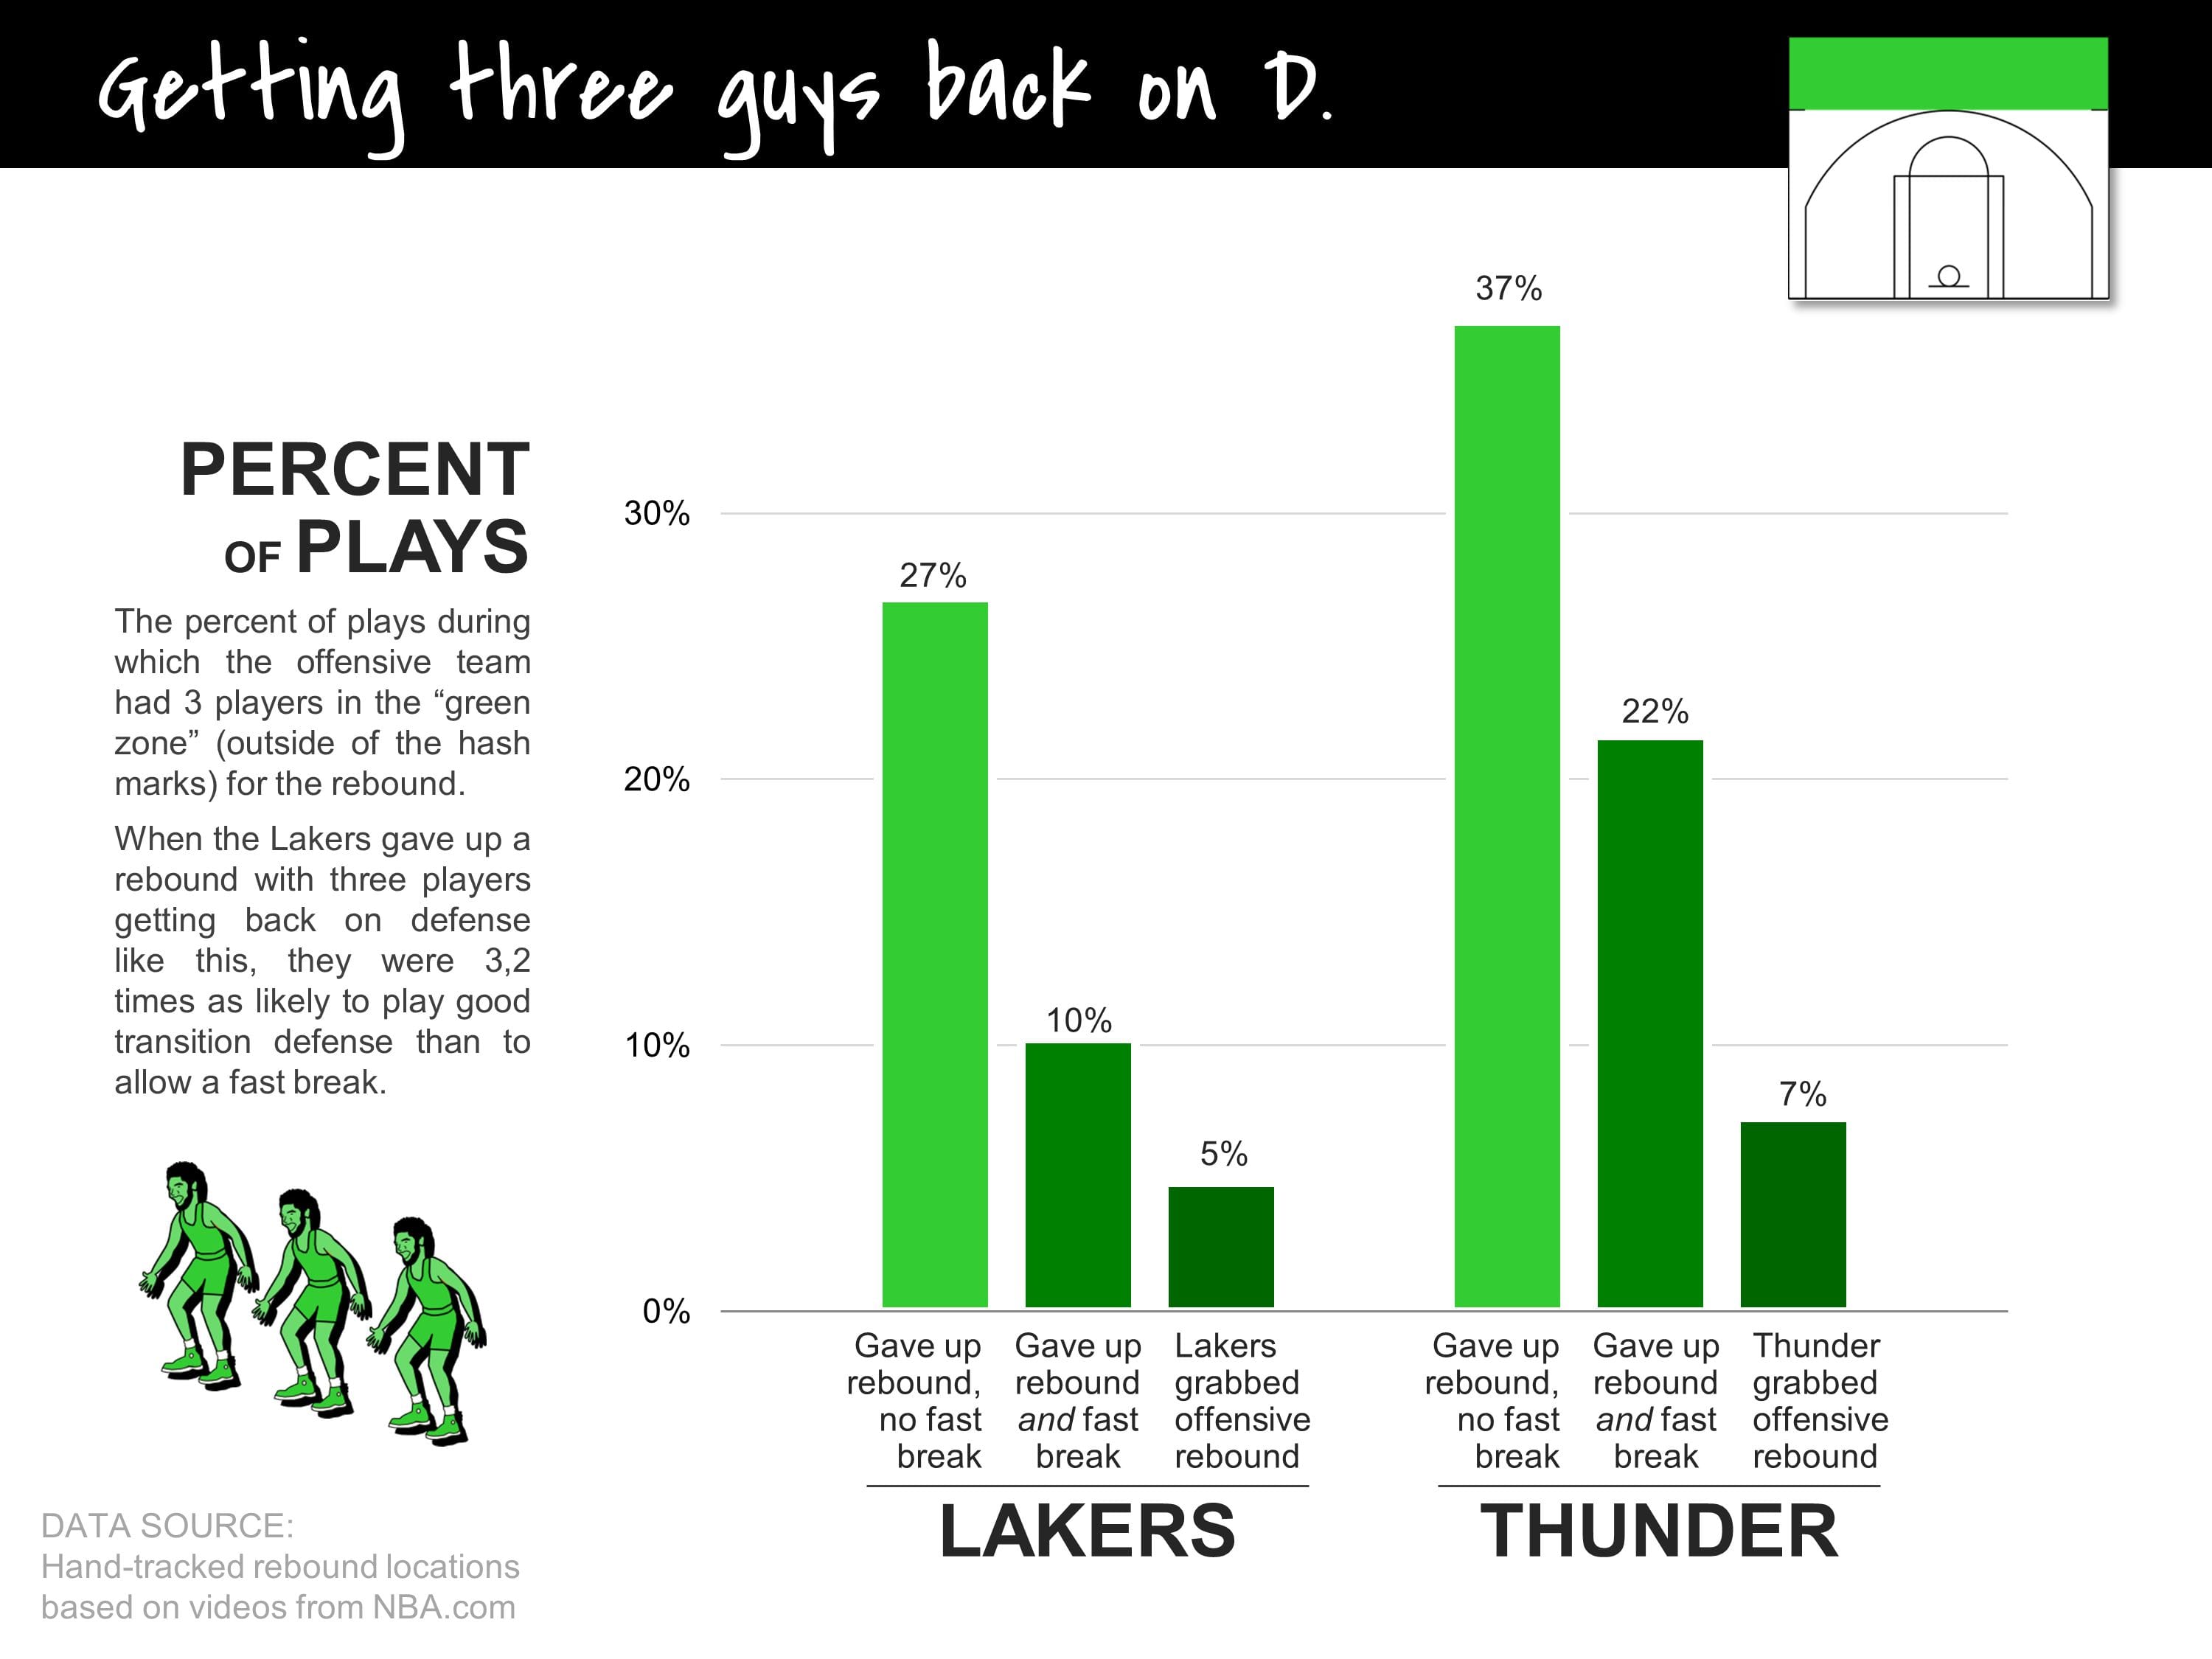
Mirroring what we saw before, the Thunder were more likely than the Lakers to have three players in the green zone on plays where they gave up a defensive rebound, regardless of the outcome of the subsequent possession for the other team. As expected, though, both the Lakers and the Thunder were less likely to have three players in the green zone on rebounds that resulted in fast breaks than on rebounds that resulted in a half-court possession. This contrast was stronger for the Lakers. When Los Angeles had three guys back in the green zone before the ball was rebounded by the other team, they were 3.2 times as likely to play good transition defense as they were to allow a fast break.
Now let’s look at the other side of the coin. How often did each team have three players in the orange/red zones at the moment the ball was rebounded? And how much did leaving three players in the orange/red zones increase a team’s odds of giving up a fast break?
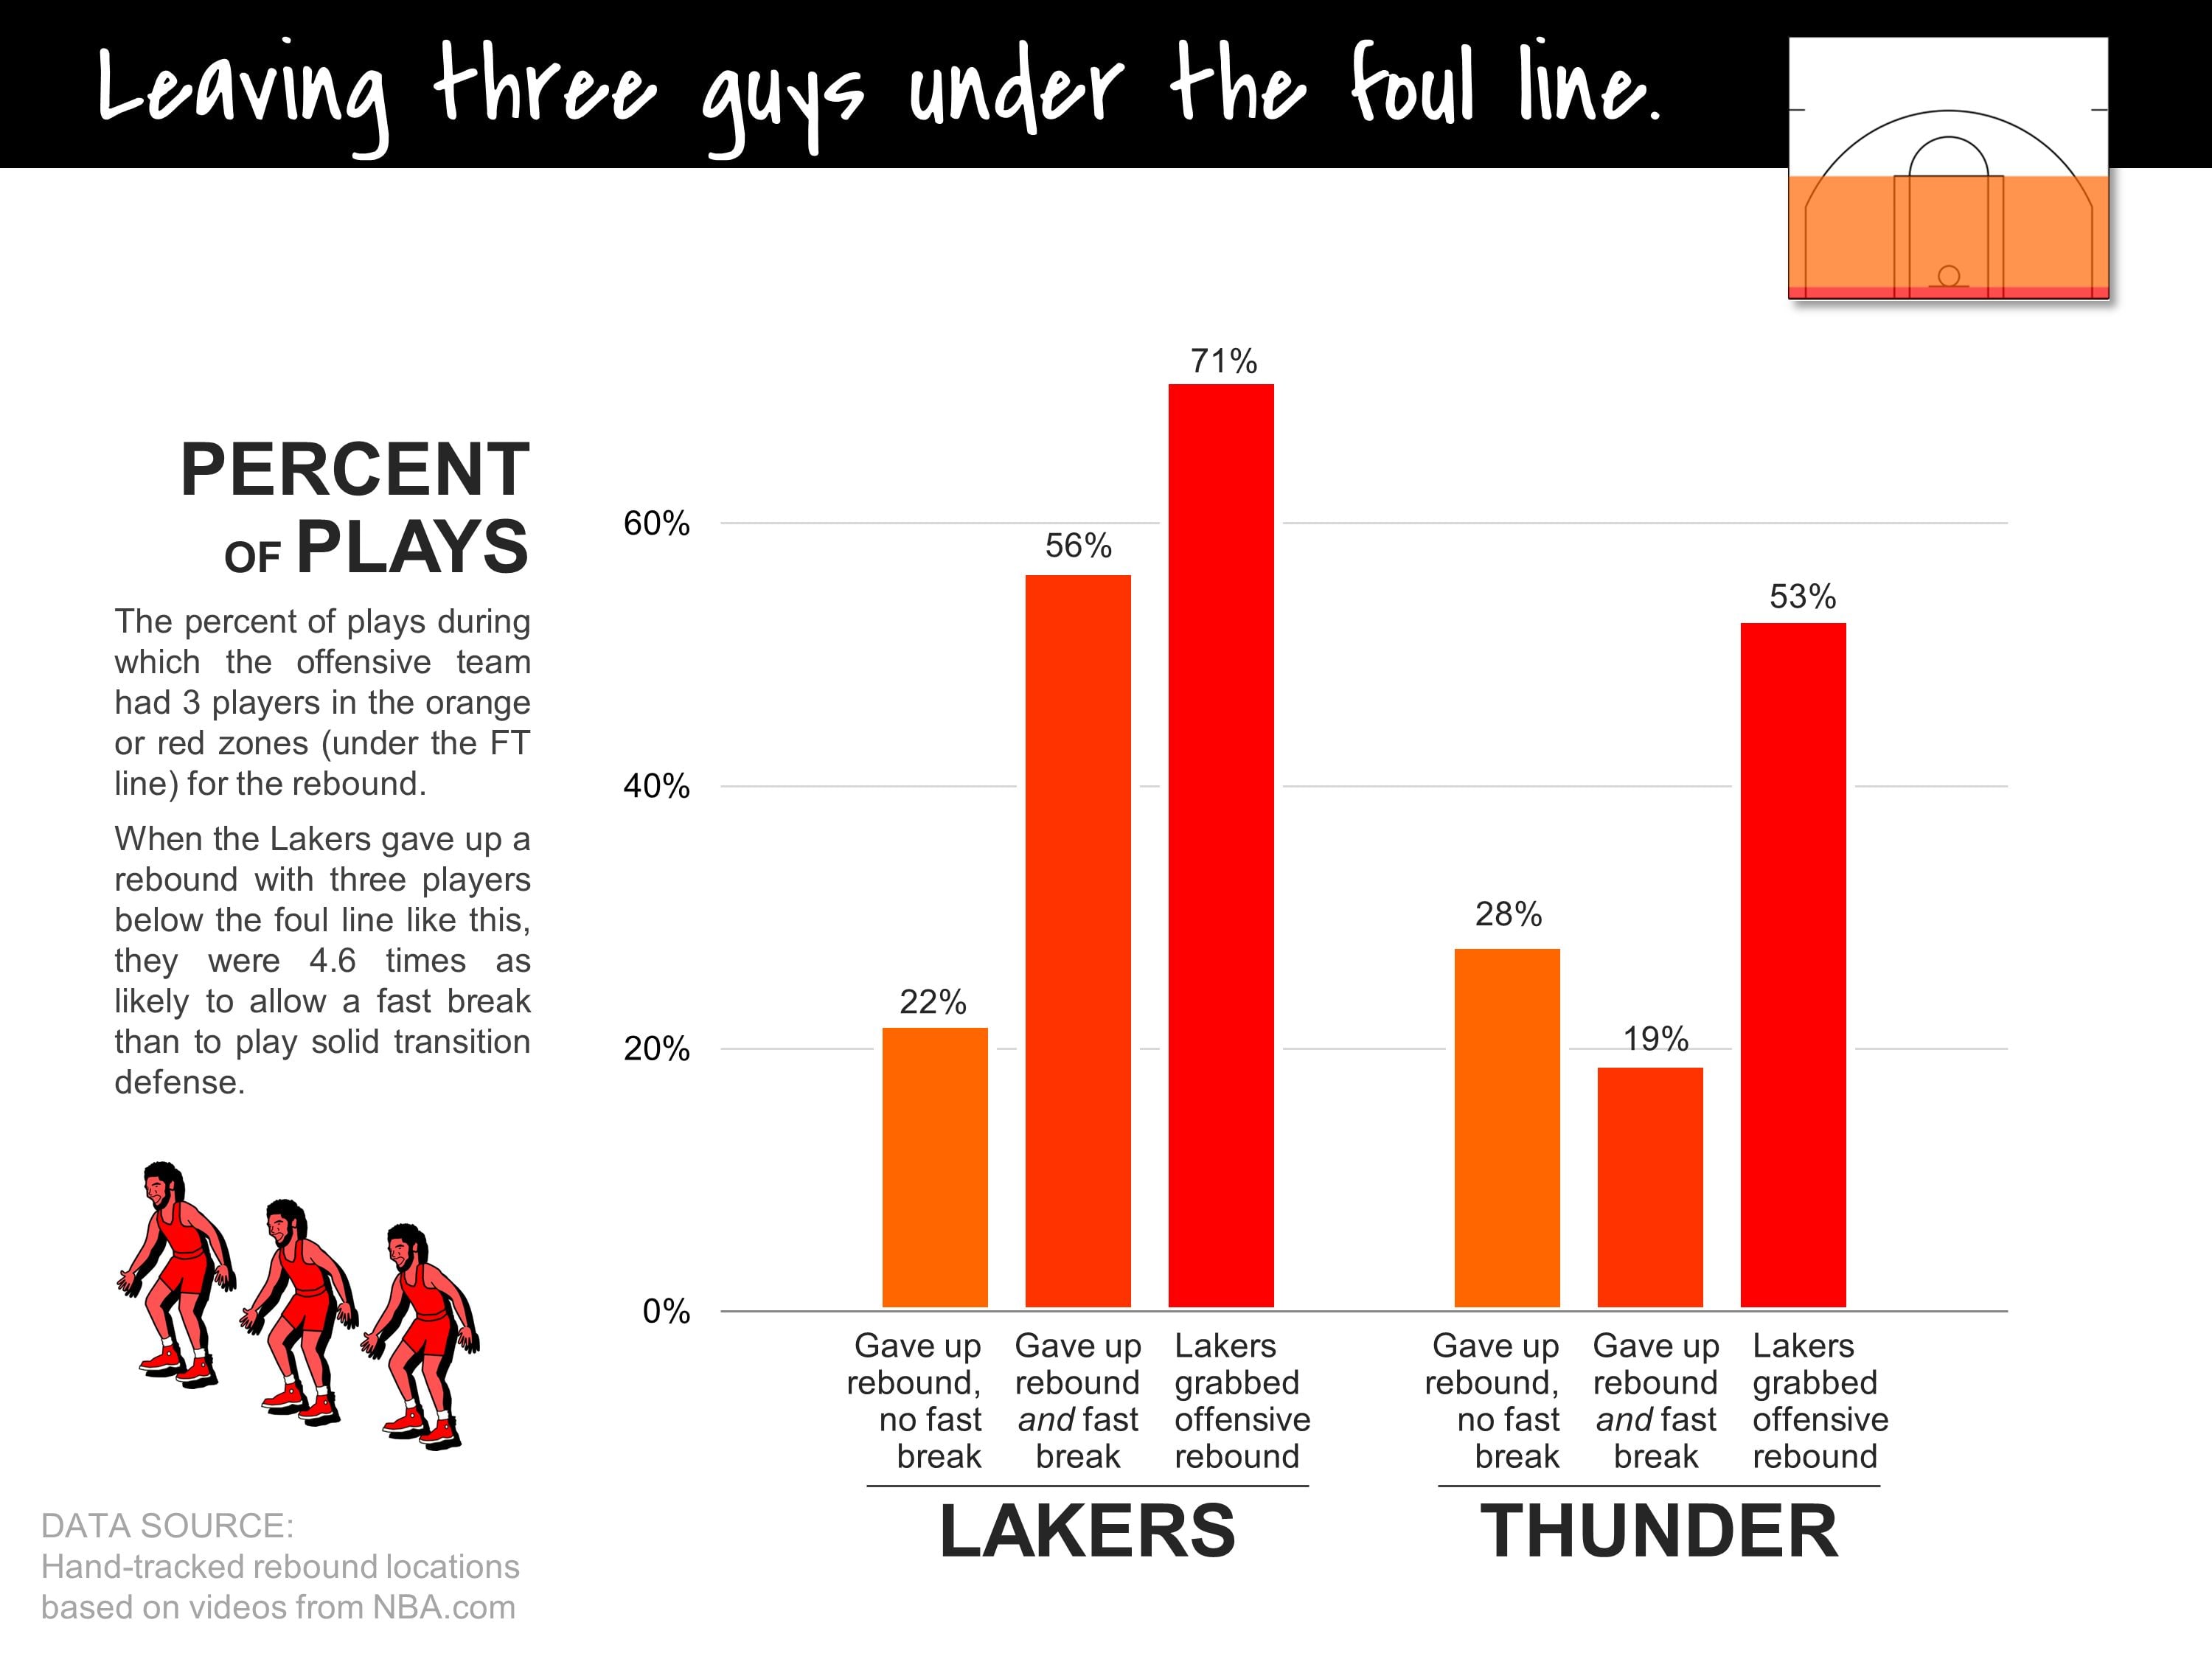
When the Lakers gave up a fast break they usually had three or more players in the orange/red zones while the other team was grabbing the rebound (56 percent of the time). When the Lakers played good transition defense they usually did NOT have three or more players in the orange/red zones (22 percent). When the Lakers left three guys in the orange/red zones while the ball was being rebounded by the other team, they were 4.6 times as likely to allow a fast break as they were to play good transition defense. The Thunder usually did not have three or more players in the orange/red zones during a defensive rebound regardless of the outcome of the opponent’s next possession. Both teams were most likely to have three or more players in the orange/red zones if they were grabbing an offensive rebound (71 percent of the time for the Lakers, 53 percent of the time for the Thunder).
So, if you’re looking for a rule of thumb to guarantee that you get good transition defense, you could tell your team that you want to have three players rotating back outside the hash marks on every shot. Alternatively, you could ask them to avoid leaving more than two guys below the foul line after a shot is attempted.
Now, to learn more about differences (and commonalities) in the rebounding strategies of the Lakers and the Thunder let’s break down our tracking data by position and look at the movement of some specific players.
Both teams have a pair of designated crashers. For the Thunder the two players who consistently hit the boards — no matter where on the floor they’re standing — are Steven Adams and Nerlens Noel. Interestingly, these two centers have not shared the court together during the 2019-20 season. Likewise, the Lakers have two always-be-crashing players in Dwight Howard and JaVale McGee. This pair have shared the court for just one minute this season.
[Side note: Anthony Davis, is a tweener in this shooter/crasher dichotomy. When he’s on the court with Howard or Mcgee he tends to be positioned further from the basket and attacks the offensive glass less often (2.9 offensive rebounds per 100 possessions). When he plays in lineups without Howard or McGee he becomes the designated rebounder (3.4 offensive rebounds per 100).]
For both teams, regardless of the outcome, the crashers tended to be below the foul line (in the orange or red zone) at the time of the rebound. The Thunder were as likely as the Lakers to have a crasher below the foul line (orange bars in the chart below) during defensive rebounds that led to fast breaks (77 percent vs. 77 percent) as well as during offensive rebounds (98 percent vs. 93 percent). In other words, both teams like to have a single player on the court who is dedicated to offensive rebounding at all times — this is one similarity between their respective rebounding tactics.
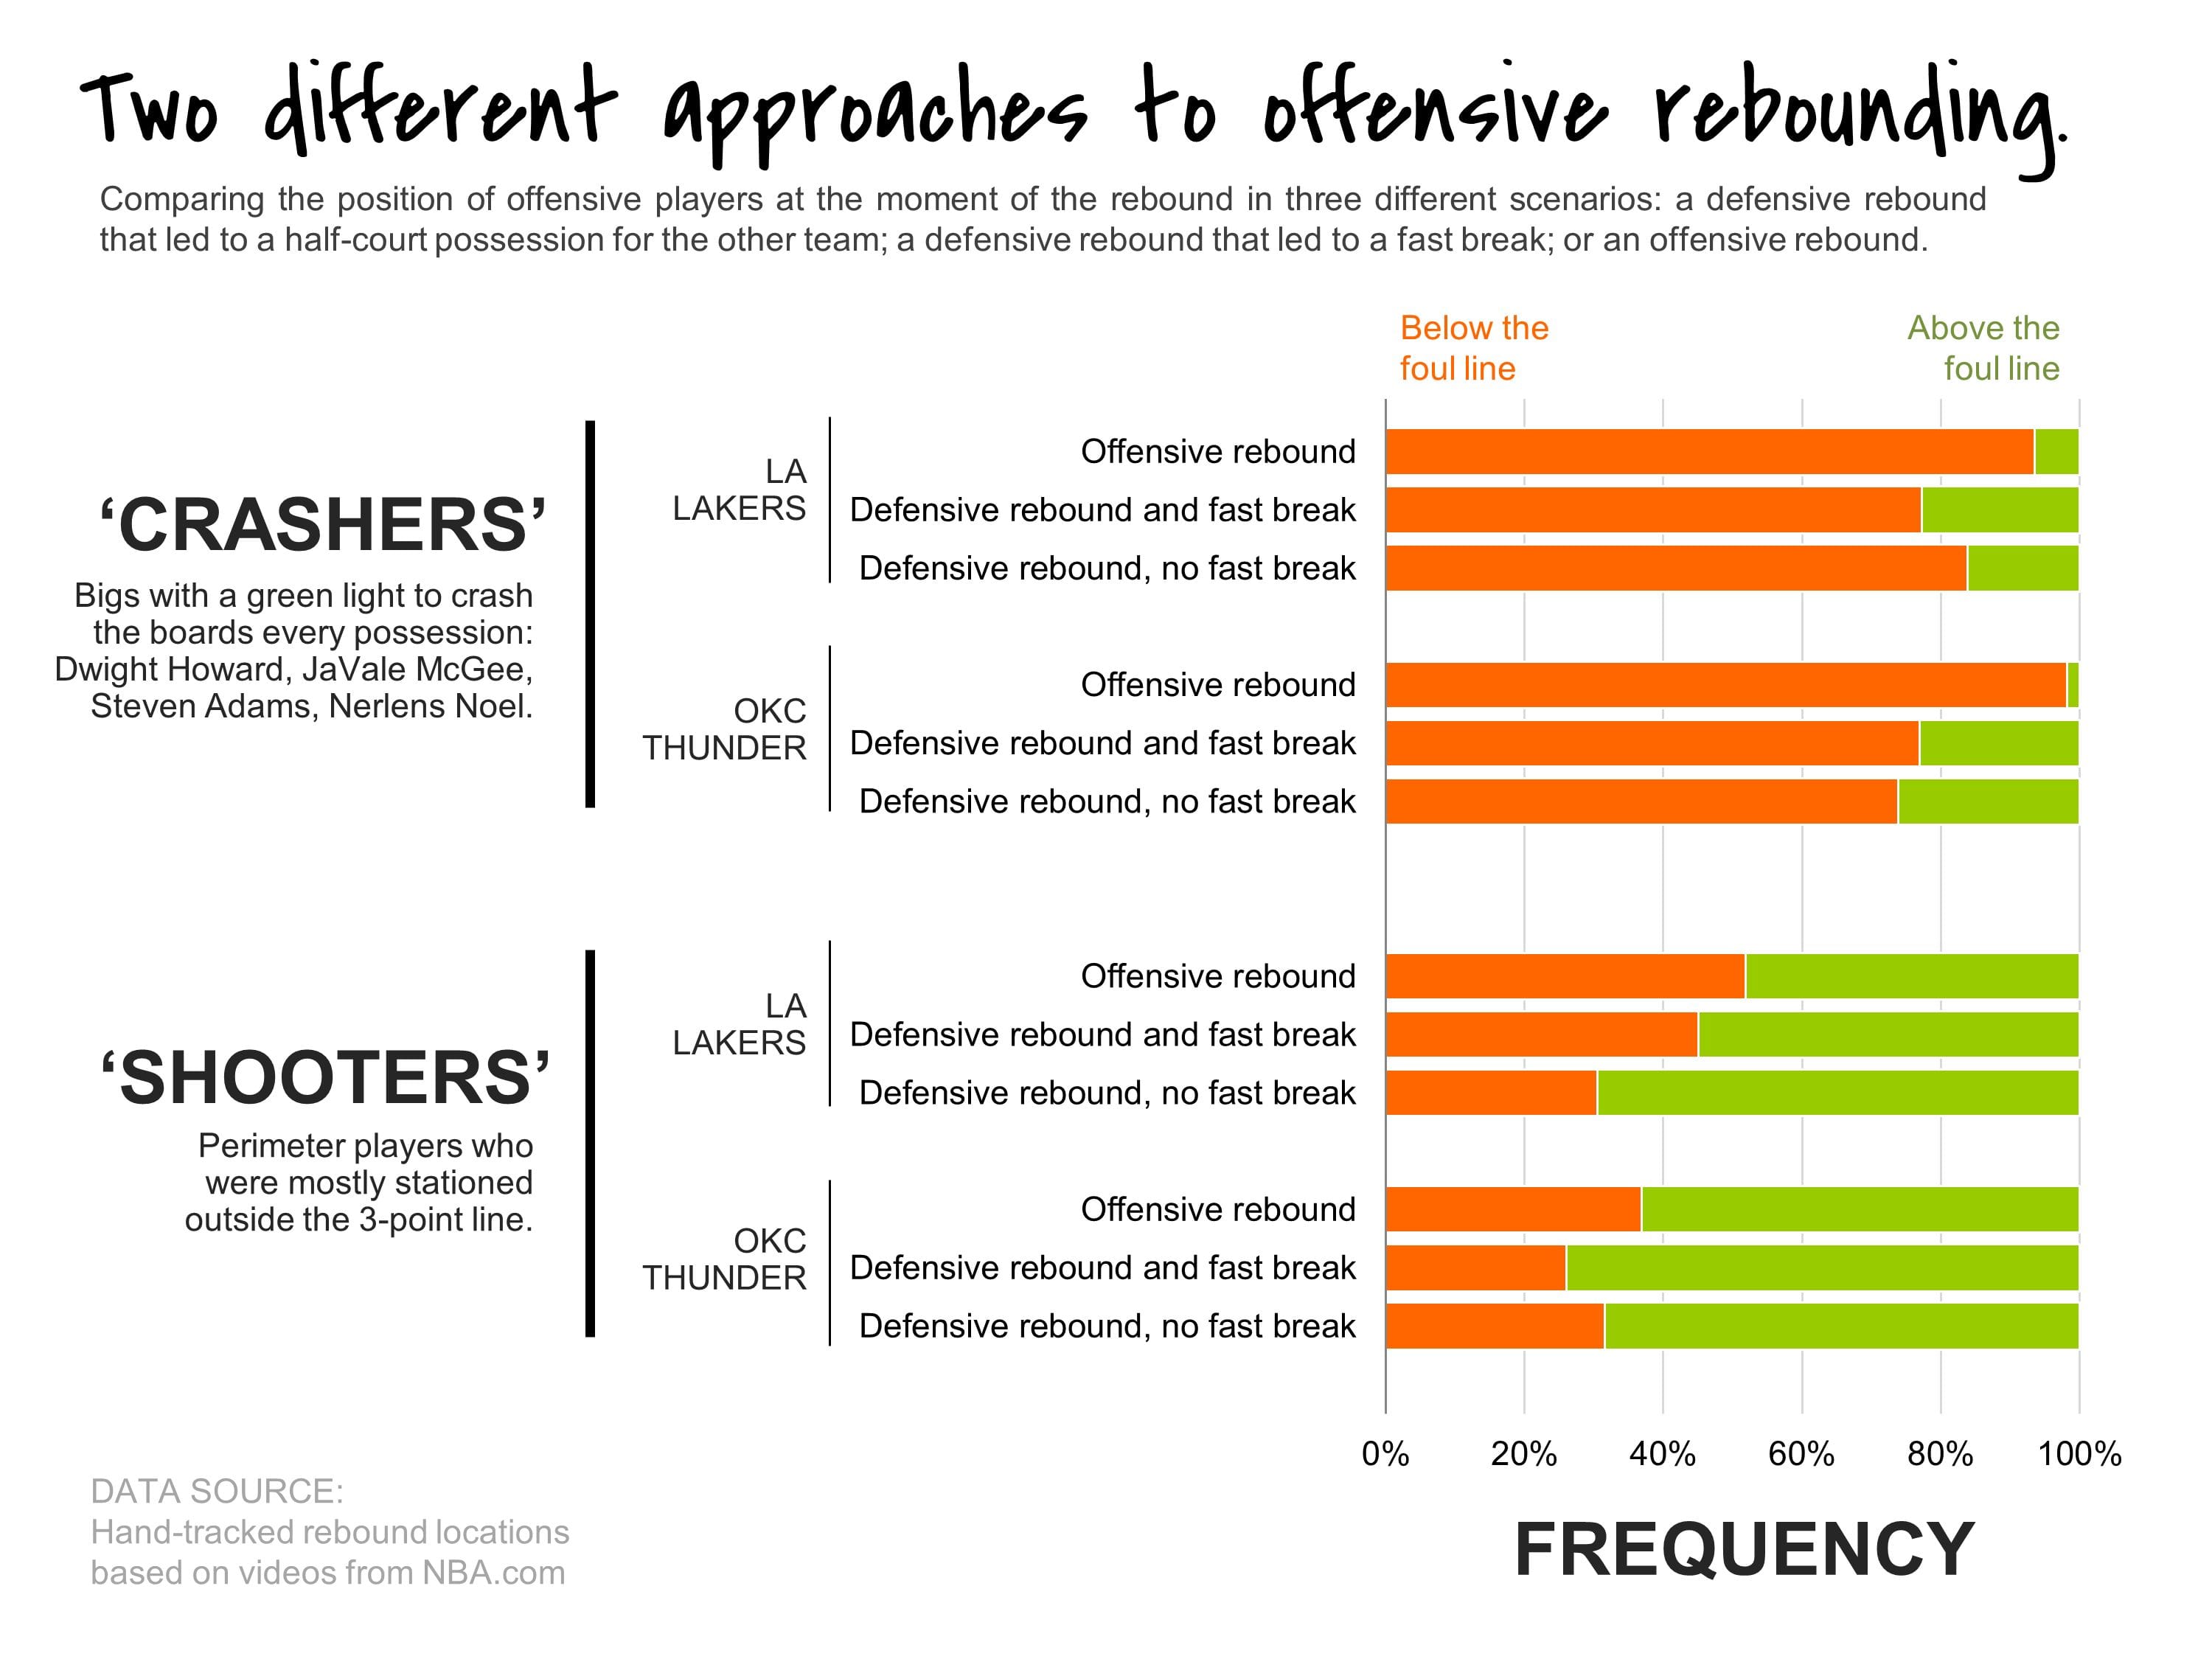
What separates the Lakers approach to offensive rebounding from the Thunder’s approach is the movement of their SHOOTERS — ie. the movement of all the various ball handlers and wings who tend to be standing on the perimeter when a shot is attempted. The Lakers were more likely than the Thunder to have a shooter in the orange/red zones during a defensive rebound that led to a fast break (45 percent vs. 26 percent) as well as during an offensive rebound (52 percent vs. 37 percent).
Based on the team rebounding stats I expected to find that the Lakers had more perimeter players crashing in towards the basket during missed shots; but, in watching the clips, what stood out to me was that the Lakers actually seemed to have more perimeter players STANDING STILL. It wasn’t so much that the Lakers were sending more players to the glass as it was them just not sending players back immediately.
Take Danny Green, for example. Per NBA tracking data provided by Second Spectrum, Green had the most offensive rebound chances of any Laker wing at 1.9 per game. But these chances weren’t necessarily coming near the rim, as his average offensive rebound distance is 11.2 feet away from the basket. The following charts show Green’s locations during the rebounds I tracked.
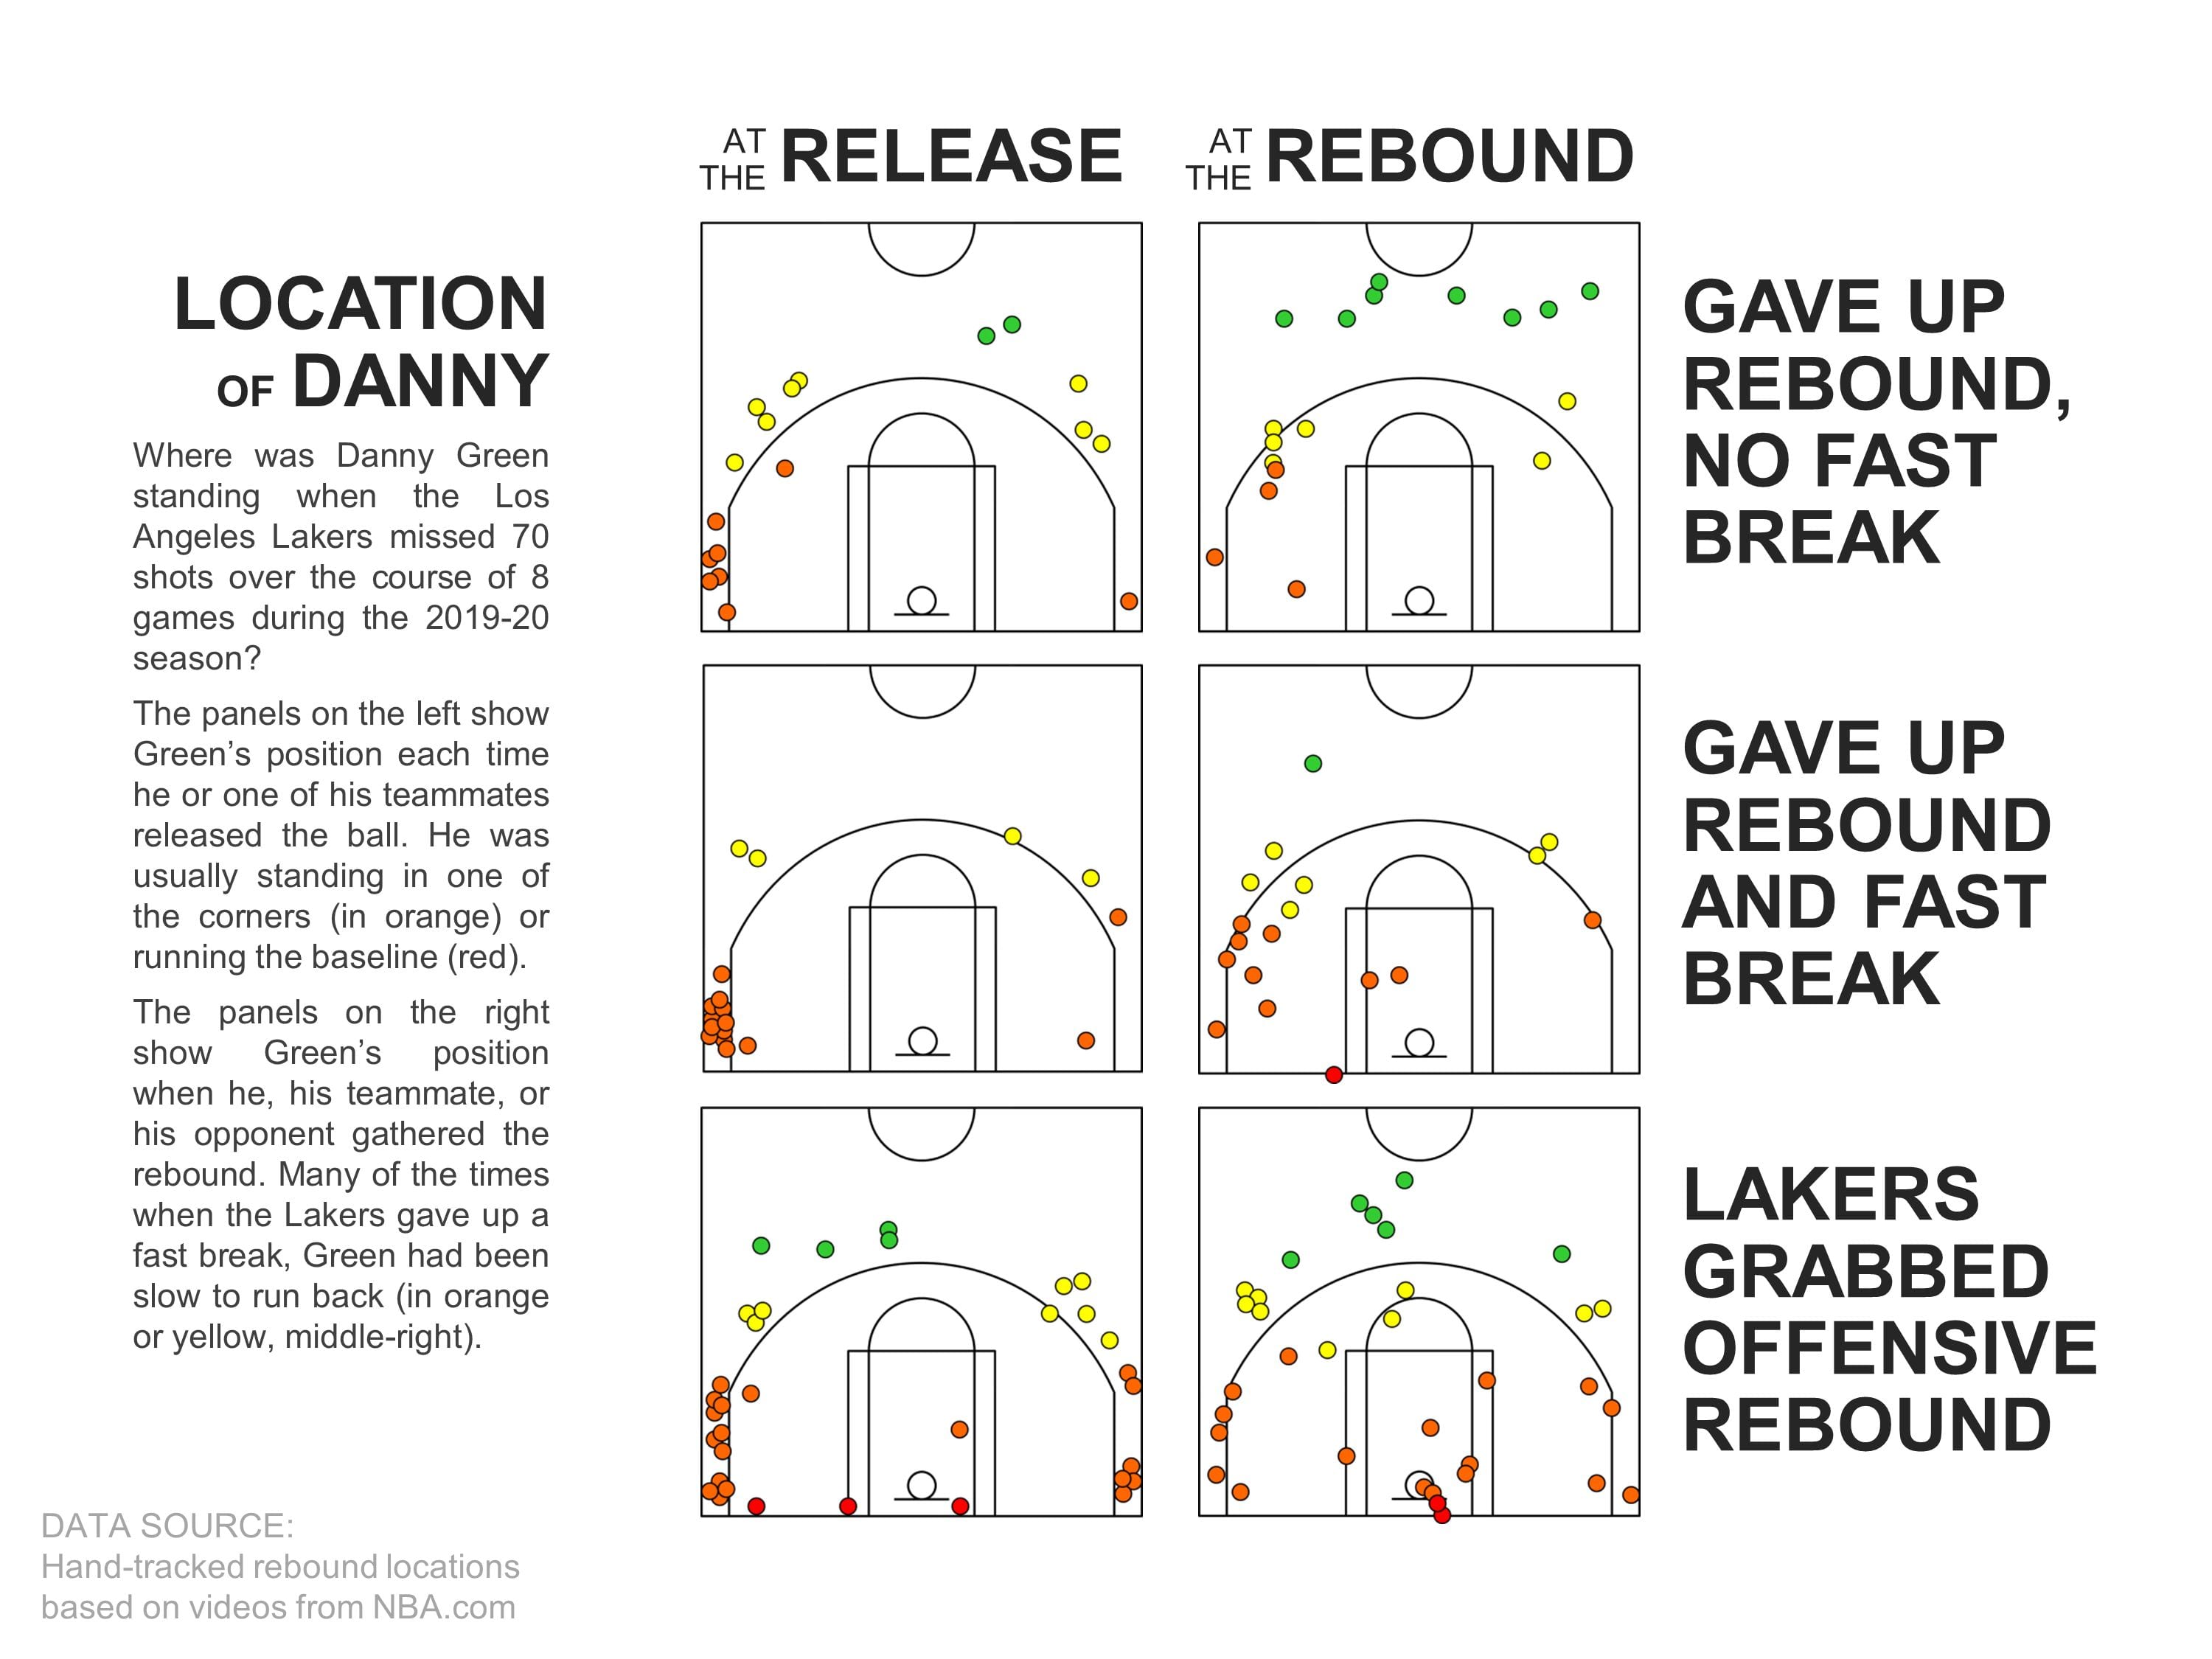
Check out the middle panels first — these are the 18 missed shots that led to the Lakers giving up fast breaks while Green was on the court. For the vast majority of these transition-defense breakdowns, Green was in the corner when the shot was released. He started in the orange/red zones on 14 of these 18 shots. By the time the other team had grabbed the rebound, Green crashed into the paint only twice. But there were nine other times where he hung around the orange/red zones without entering the paint; not crashing but also not getting back.
Now look at the bottom panels — these are 34 missed shots that led to a Laker offensive rebound while Green was on the court. Here’s the breakdown of where he was standing when the shots were taken: he was in the green zone four times, in the yellow zone eight times, in the paint three times, and in the rest of the orange/red zones 19 times. And if we look at his corresponding positions when the rebounds were secured we can infer his typical movement: he was in the green zone six times (+2), in the yellow zone nine times (+1), in the paint eight times (+5), and in the rest of the orange/red zones 11 times (-8). So that’s something like 26 plays where he stayed where he was, three plays where he got back, and only five plays where he really crashed.
Finally, contrast those first four panels with the top panels — 18 missed shots that preceded good transition defense by the Lakers. In these instances, Green was more likely to be on the wing or at the top of the key (11 times) than in the corners (seven times) when the shot was released. And at the time of the rebound Green had moved towards the basket once, he had stayed in the corner once, and he had gotten back to the green zone eight times.
Based on these charts, Green looks like a barometer for the Lakers transition defense. He was in the orange/red zones 61 percent of the time when the Lakers gave up a fast break and in the green zone only six percent of the time. In contrast, he was in the green zone 44 percent of the time when the Lakers played solid transition defense and in the red/orange zone only 22 percent of the time. With such a small sample of rebounds, it’s hard to say if this was more than just a coincidence; but it does give us a sense for what the Lakers wings are doing after missed shots.
Now let’s compare Green with Thunder wing Danilo Gallinari. Gallinari is comparable to Green in his number of offensive rebounds (0.6 vs. 0.7) and offensive rebound chances (1.6 vs. 1.9) per game, albeit in five extra minutes. The two 3-point specialists also had basically the same average offensive rebound distance (11.3 vs. 11.2 feet). These were Gallinari’s positions at the time of the release and at the time of the rebound for the plays I tracked.
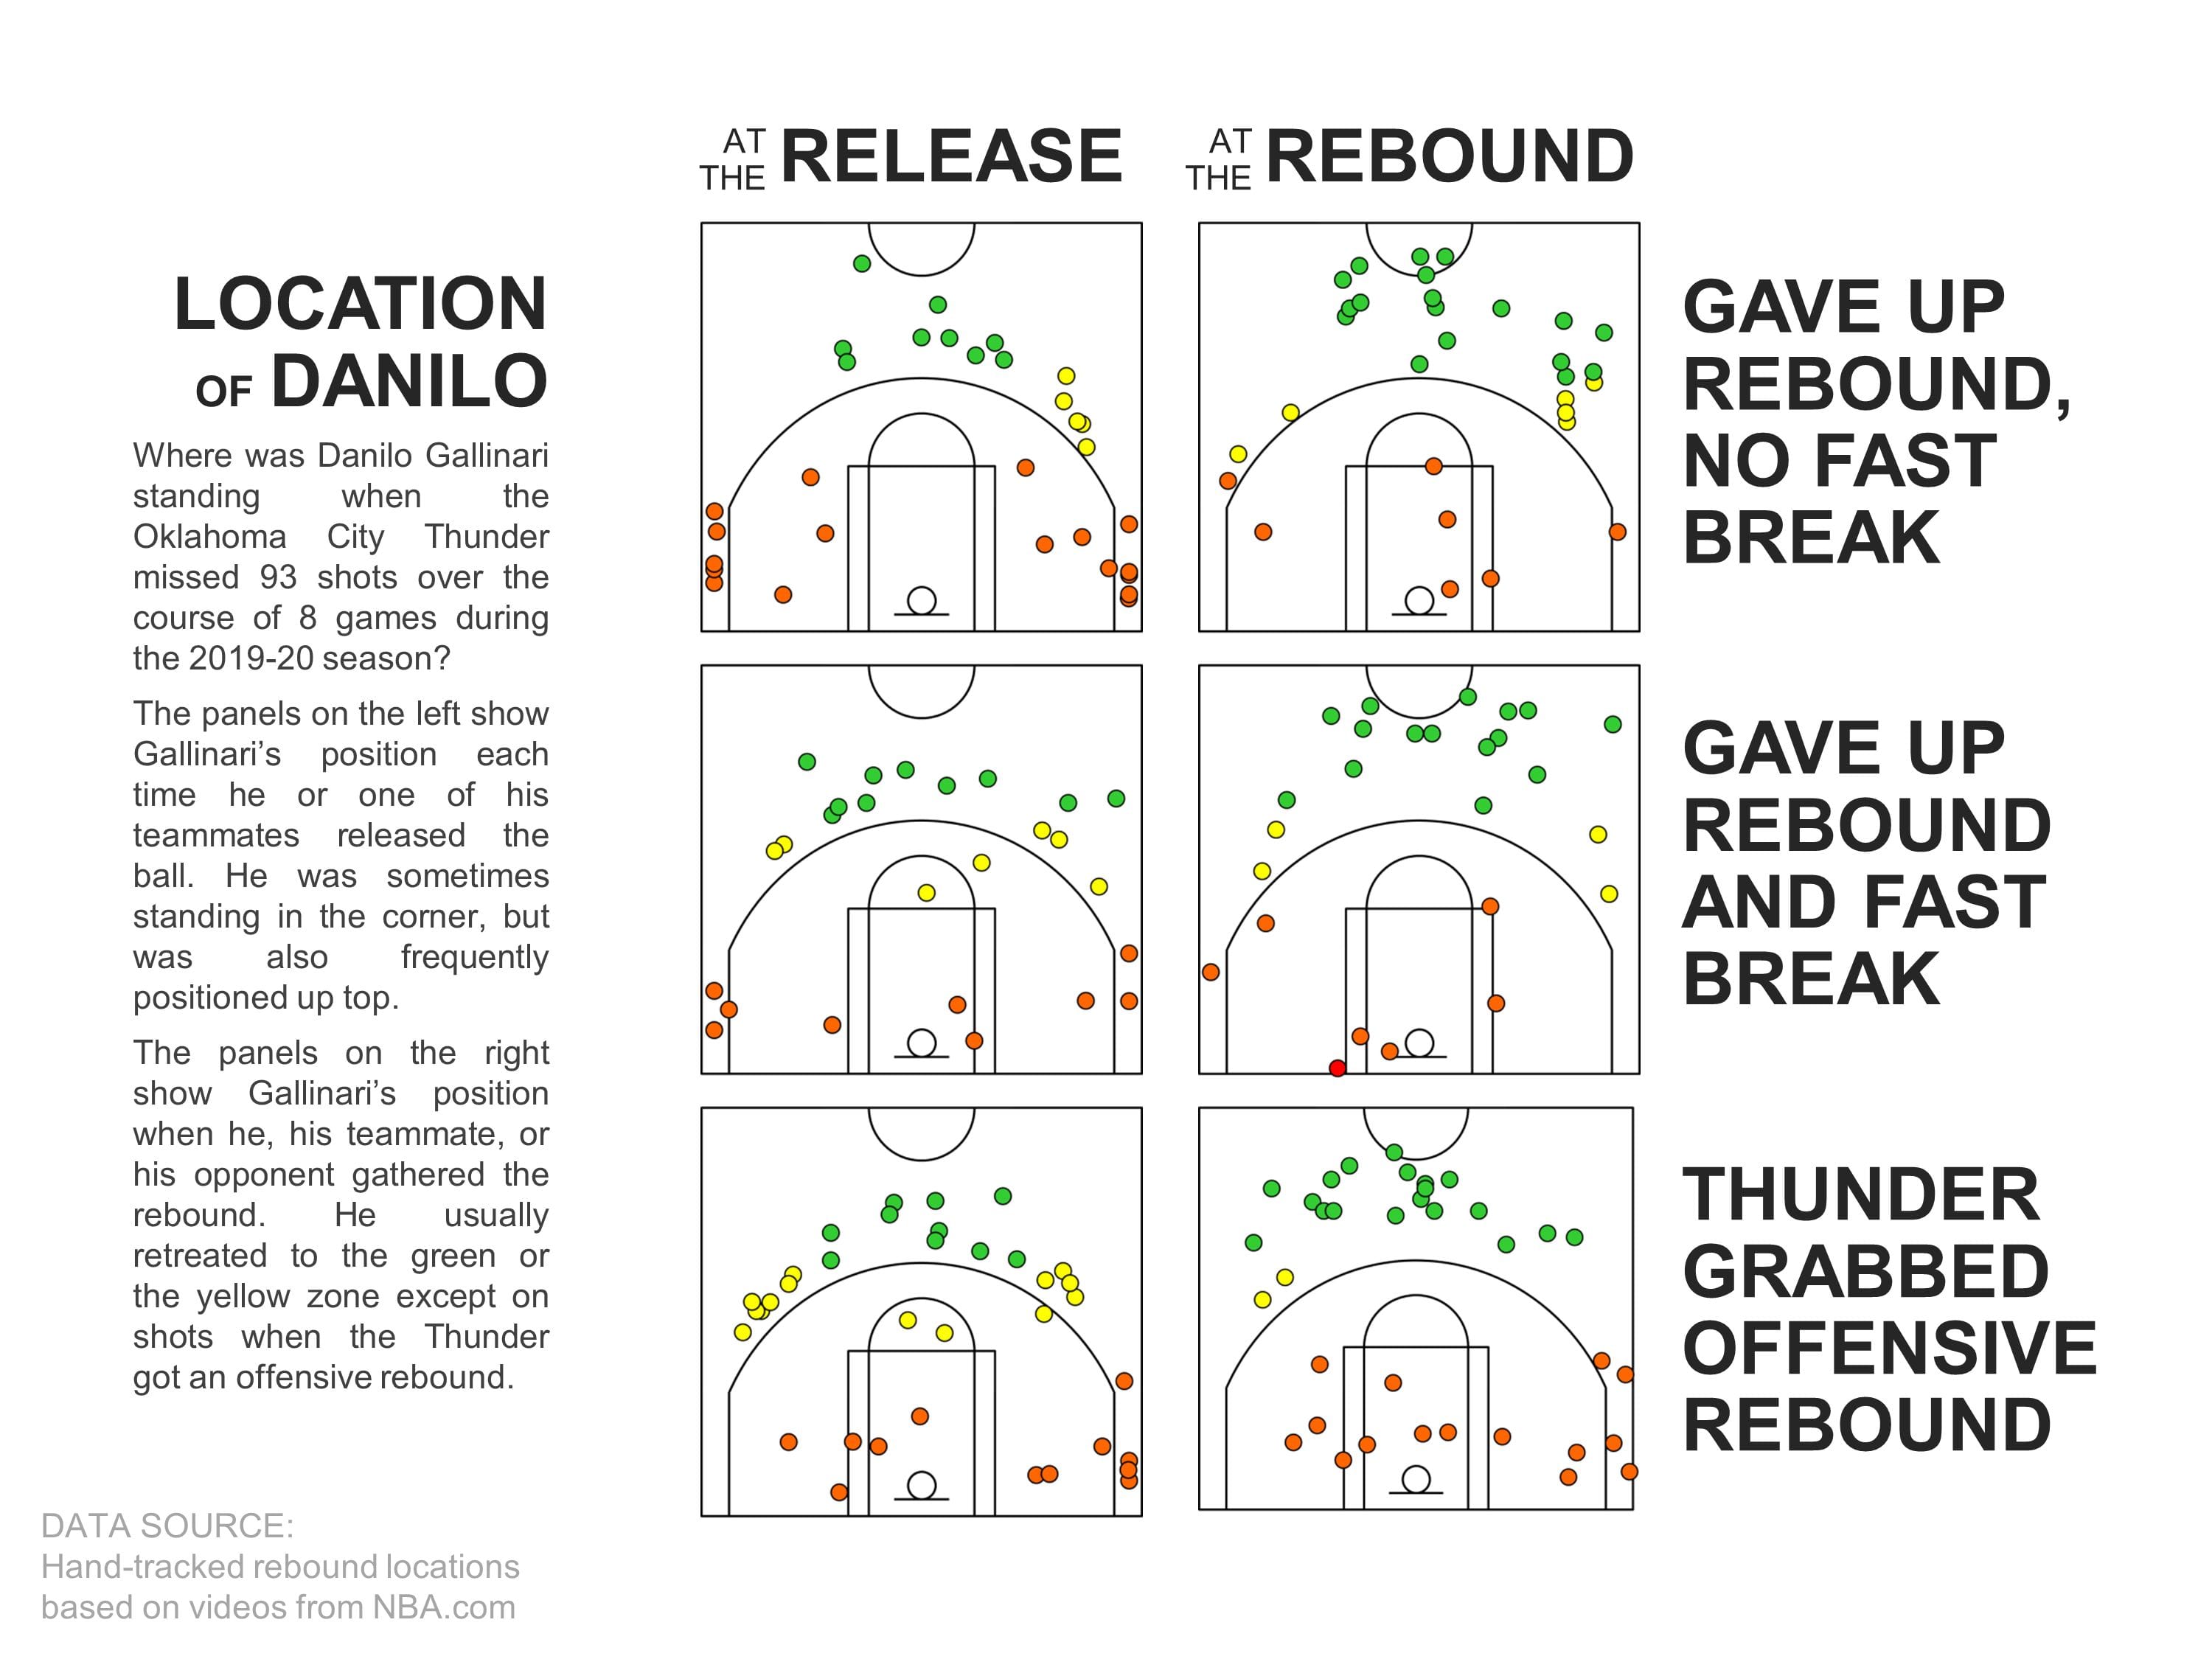
The first difference between Danilo and Danny that jumps out here is that there are a lot more green and yellow dots on Gallinari’s charts. But if you take a closer look you’ll notice that Gallinari was often already standing in the green/yellow zones at the moment the shots were RELEASED. Gallinari was more likely than Green to be on the wing or at the top of the key and less likely to be in the corner, an observation that is consistent with Gallinari’s lower corner-3 frequency (6 percent vs. 30 percent). Moreover, Gallinari was more likely than Green to be standing several feet behind the 3-point line, which is consistent with Gallinari’s longer average 3-point distance (26.0 vs. 24.9 feet). Because Gallinari’s offensive positions tended to be more spaced out than Green’s, he had an inherent advantage in getting back on defense. This was also the case for other Oklahoma City shooters Chris Paul and, to a lesser extent, Shai Gilgeous-Alexander and Dennis Schroder.
To find a more direct positional comparison for Green, let’s see what Thunder wing Terrance Ferguson did after his team missed a shot.
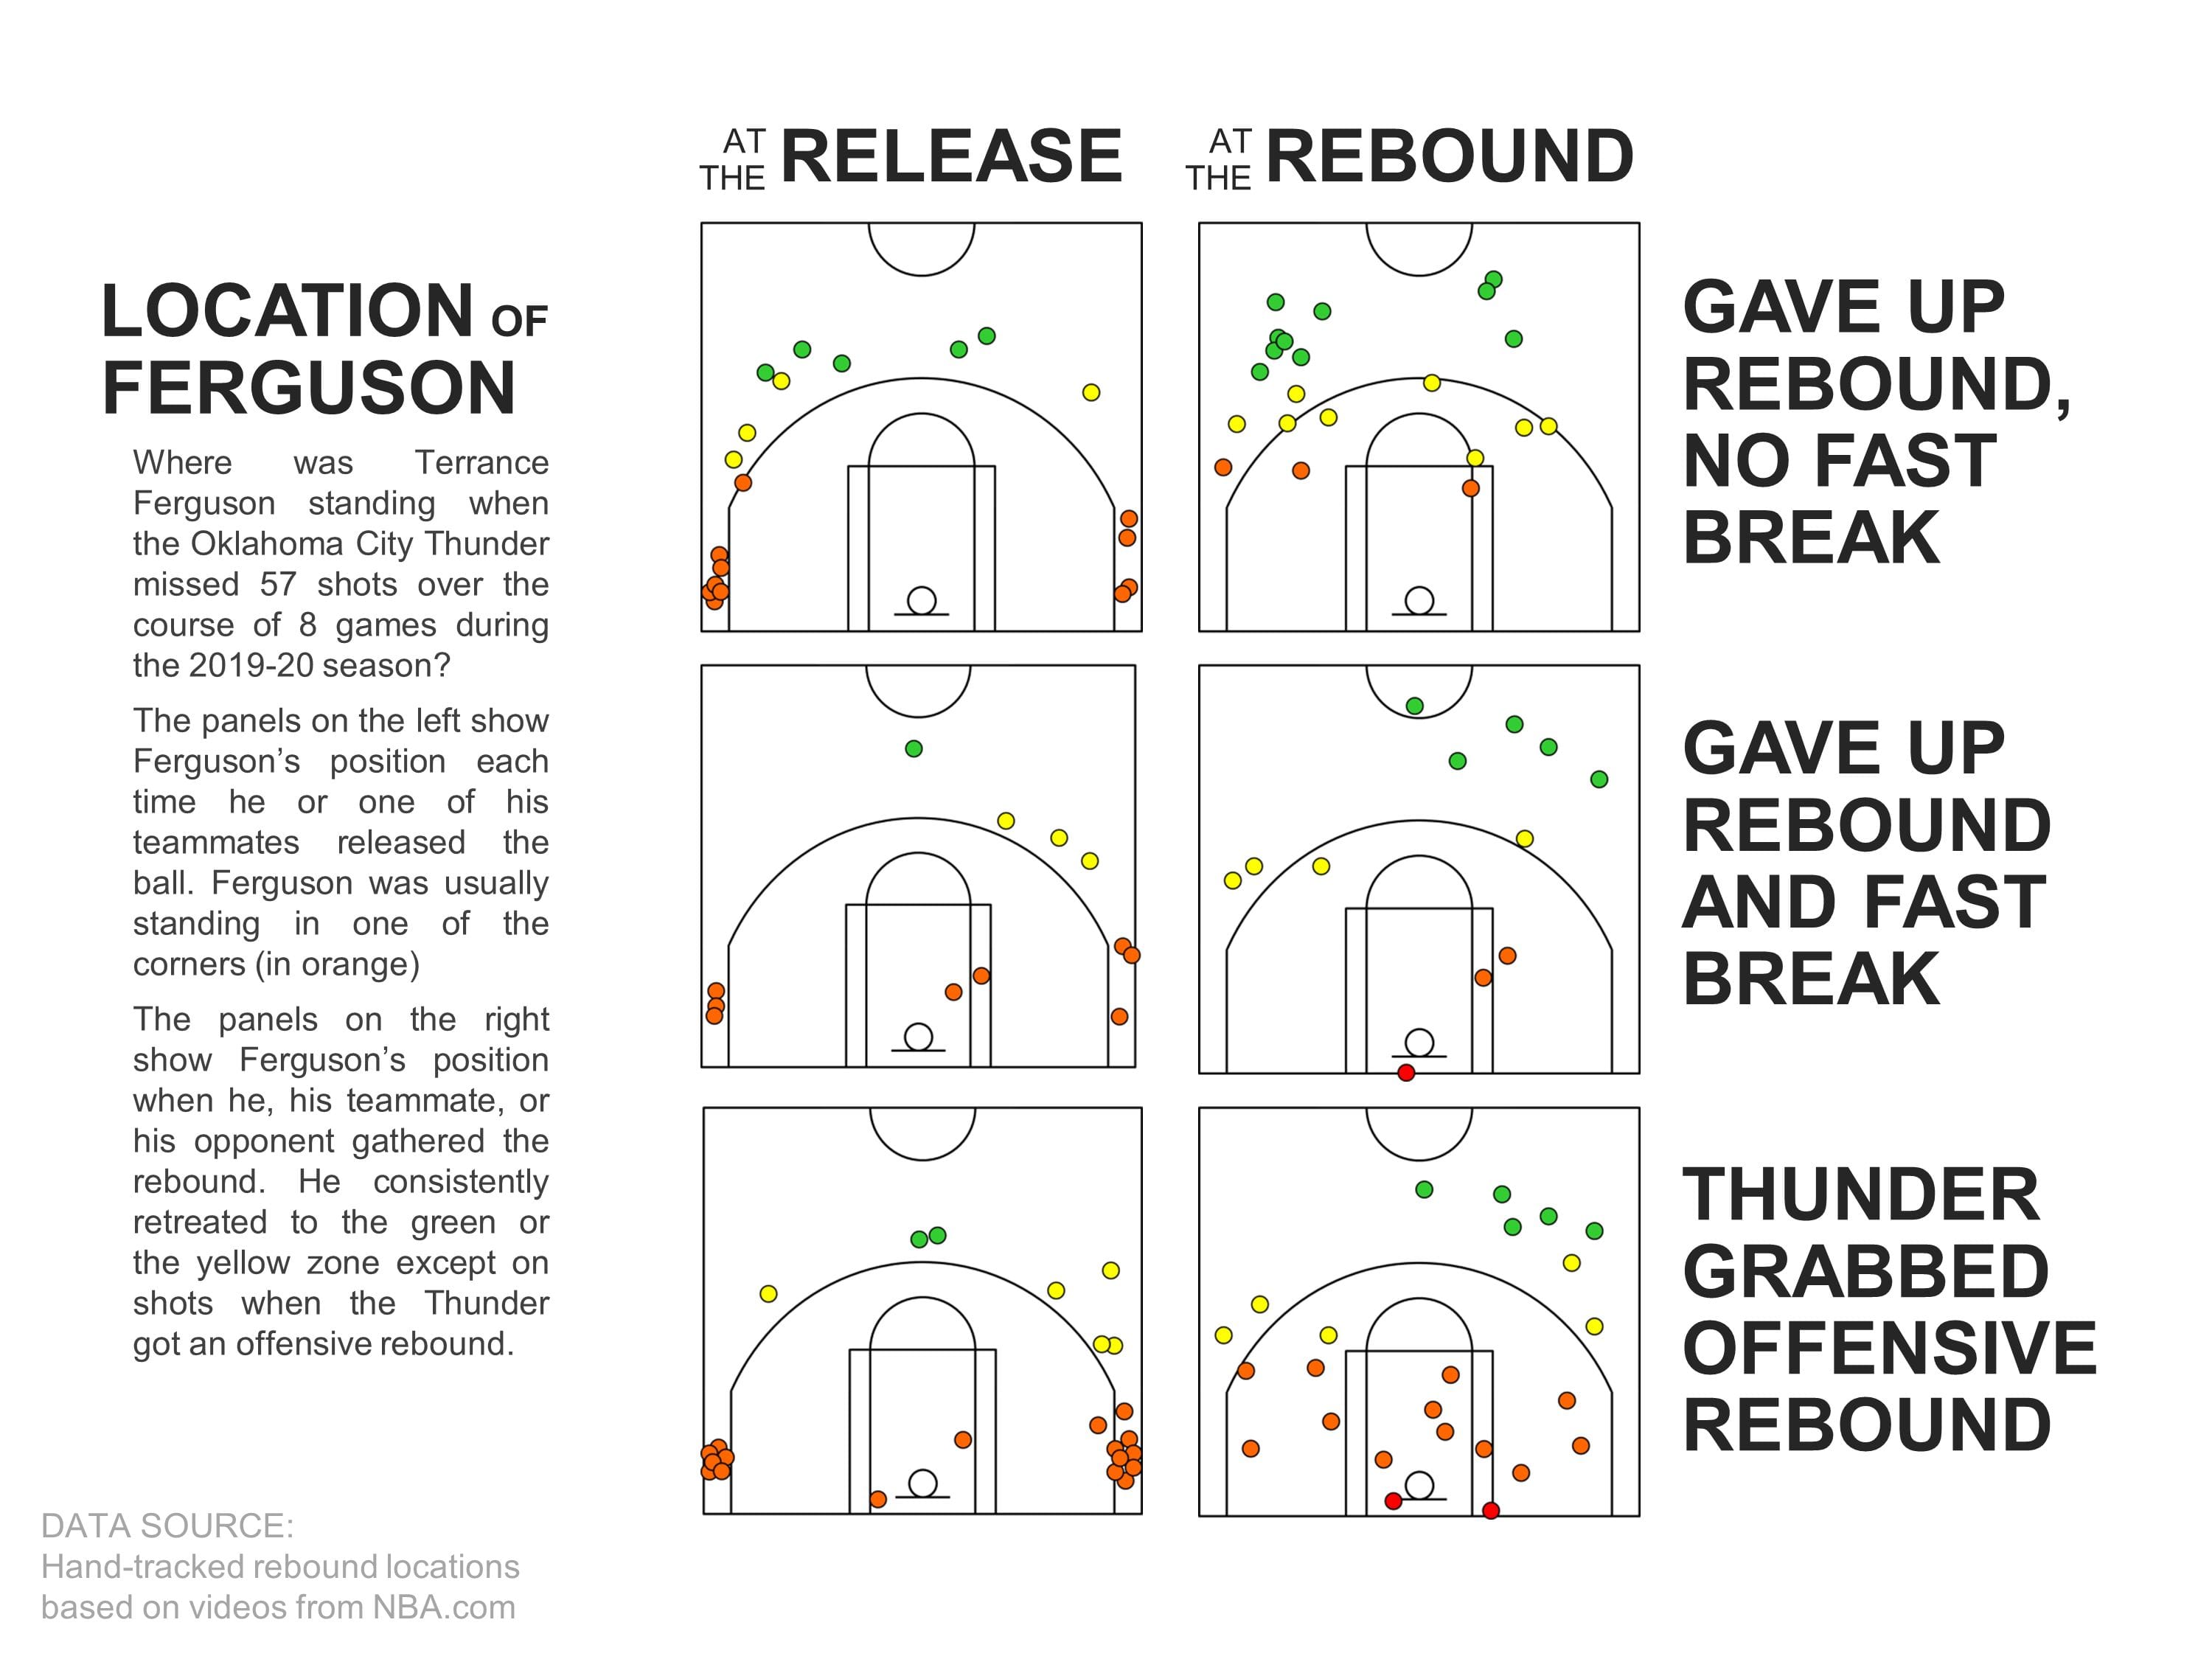
Ferguson, like Green, was often spotting up in the corner when his team attempted a shot — he was there on 31 of the 57 plays that I tracked (54 percent), which is consistent with his high corner-3 frequency of 35 percent. Despite starting off in similar positions as Green, by the time the rebound was collected, Ferguson was much more likely to have retreated out past his team’s foul line than his Laker counterpart. Just take a gander at that upper right-hand panel! Look at all the empty space below the foul line. On plays where the Thunder prevented fast breaks, Ferguson did a very reliable job of getting back, dropping into the green zone about half of the time (48 percent). During the 20 instances when Ferguson failed to clear out of the orange and red zones, it was often because he was crashing the offensive boards — he reached the paint 10 times (50 percent).
Now, let’s review. Both teams have a pair of crashers and both teams rebound opportunistically from the perimeter; however, whereas the Thunder wings run back with regularity, the Lakers wings are less consistent, sometimes waiting around to see what will happen.
From an outsider’s perspective, it’s hard to say if the Laker wings are choosing not to get back by design. Is it a tactic or just a bad habit? I’m not sure.
Here’s another tough question: would the Lakers be better off if their wings got back on defense sooner and more consistently? Should their wings be rebounding more like the Thunder wings?
To answer this question, we first need to consider how the value of an offensive rebound depends on the person who is grabbing it.
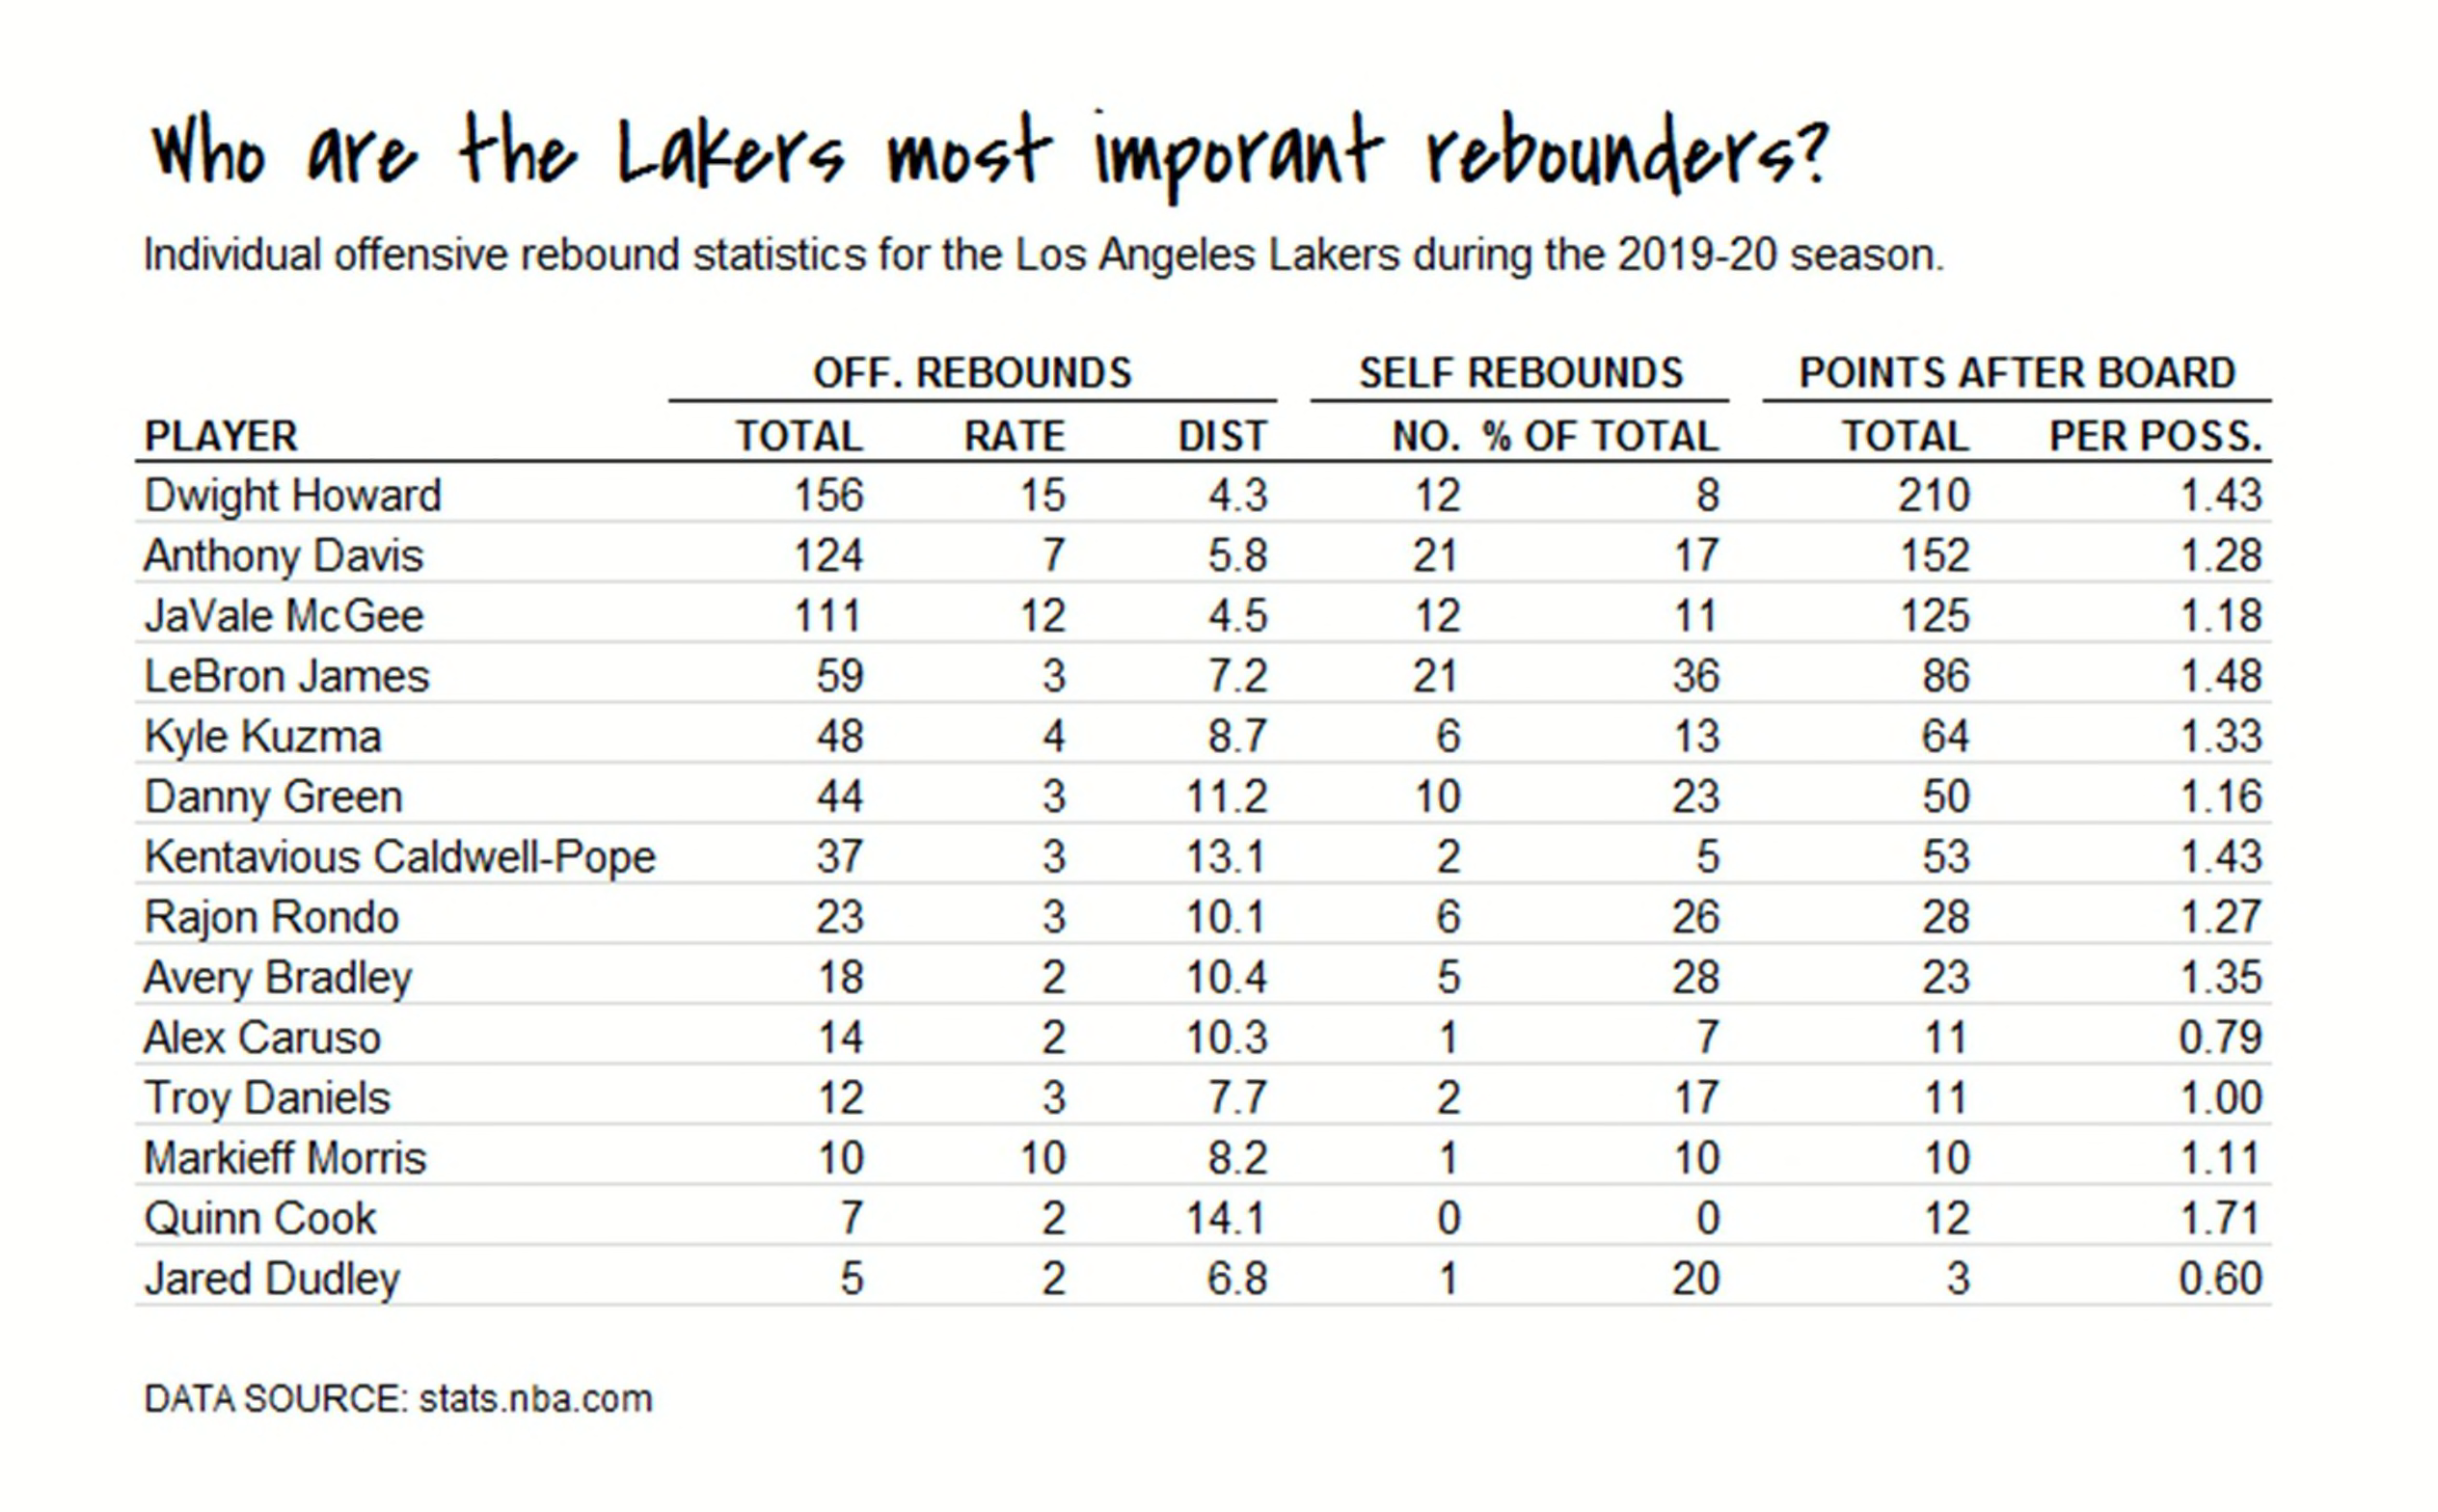
Howard was the Lakers most prolific offensive rebounder. And on possessions when Howard got an offensive rebound the Lakers ended up scoring a healthy 1.48 points on average. That’s way above LA’s average offensive rating of 1.14 points per possession and it’s a result of Howard rebounding the ball very close to the basket, only 4.3 feet away on average. In comparison, the average offensive rebound by the bottom-10 Lakers in the table (from Kyle Kuzma to Jared Dudley, mostly wings) was collected 10 feet from the hoop and the Lakers scored just 1.24 points per possession when one of those guys got the board. Green, in particular, failed to grab the really juicy offensive rebounds, producing just 1.16 points for an average possession when he grabbed a board.
So then, does Green’s extra offensive rebounding add value (relative to a Thunder wing-like Ferguson, for example) or not?
Well, over the course of 100 missed shots by his team, we would expect Green to grab 2.97 offensive boards; whereas Ferguson would get fewer, just 2.25. That’s a difference of 0.72 possessions extended by Green or the equivalent of +0.84 extra points (0.72 extended possessions at 1.16 points per possession). Is that more than he costs the Lakers in defensive transition?
Based on the small sample of rebounds that I tracked, over the course of 100 missed shots by his team, we would expect Green to be in the orange or red zone on 41 occasions of which 15 would turn into a fast break for the opponent. Ferguson, on the other hand, would be in the orange or red zone on 26 occasions of which only 5 would turn into a fast break for the opponent. So, in theory, if Green was as committed to getting back as Ferguson he might help the Lakers prevent an additional 10 fast breaks for every 100 shots they missed.
What’s that worth? Over the course of the season, in the 1063 situations where the Lakers gave up a defensive rebound that led to a half-court possession they allowed an effective field goal percentage of 49 percent. In the 530 situations where they gave up a defensive rebound that led to fast break possession the Laker defense allowed a more generous effective field goal percentage of 59 percent. That’s a difference of 10 percent from the field or about 0.2 points allowed for each additional fast-break possession (leaving aside those pesky fast-break free throws, which I can’t query on PBPstats.com).
To sum up, over the course of 100 missed shots, Green’s rebounding approach is gaining the Lakers 0.72 extra chances (relative to Ferguson’s approach) worth +0.84 points while giving up 10 extra fast-break possessions to the opponent at a cost of -2.00 points. By this accounting, Green is costing the Lakers a little more than 1 point per 100 missed shots or about one-quarter of a point per game.
But, unlike Mbah a Moute and the board-crashing Bucks of 2010 (or the Bucks of 2020, for that matter), Danny Green and the Lakers don’t need to be worried about LeBron James rushing down the court to dunk on their heads; and, ultimately, a little lackadaisical transition defense probably won’t be the end of the world for them.