A new approach to using measures of role, skill and quality to optimize fit and player combinations in NBA lineups.
What would be a more valuable move for our team — adding another stretch big or finding a vertical spacer? What should we be targeting in free agency this summer — more dynamic play-making or better shooting? Can we really survive for 40 minutes a night without a rim protector on the floor? These are the kinds of questions that teams are asking themselves when making trades, acquisitions, and draft picks. And — in one way or another — these are all questions of lineup fit.
Front offices want to find the best possible players for their rosters, but they also want to find players that fit together nicely. Optimized lineup fit allows a team to get the most out of its player talent and payroll. I took a stab at quantifying lineup fit once before, using stats for time of ball possession, 3-point volume, and rim-protection frequency to define player archetypes and identify synergistic lineup combinations. The big limitation of this previous project was that I ignored players’ skill levels, lumping together the best and worst guys from each role.
In this post, I am taking a second look at optimizing lineup fit using the talent grades developed by Tim (@Tim_NBA) and Jacob (@JacobEGoldstein) at the Bball-Index. These grades use publicly-available stats to provide objective measures of skill that are designed to be independent of team-specific factors such as coaching, schemes, and teammates. For my analysis, I used six seasons of percentile ranks for the following talent grades: 3-point shooting, off-ball movement, playmaking, one-on-one, roll gravity, finishing, post play, offensive rebounding, defensive rebounding, total rebounding, perimeter defense, and interior defense. I linked these talent grades with six years of play-by-play data from PBPstats.com (70k lineups, 1.4M possessions) to find out which skills contribute most to offensive and defensive success.
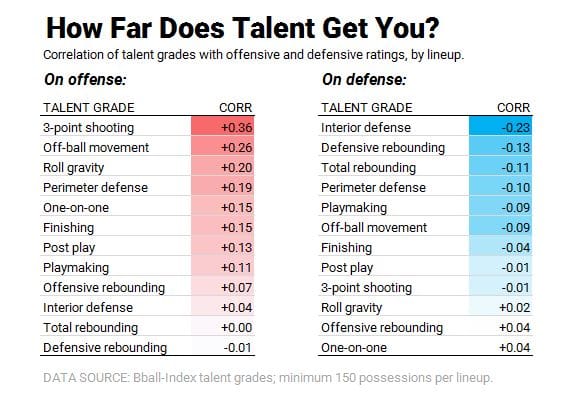
For the tables above, I simply summed the talent grades (as percentiles) for the five players in each lineup and then calculated the correlation between the lineups’ total talent grades and their offensive and defensive ratings (i.e., points scored and allowed per 100 possessions) for any combination that played together for at least 150 possessions during a single season.
Using this really crude approach it appeared that a lineup’s offensive rating was most closely tied to the perimeter-shooting talent of its players (in red, on the left). To a lesser extent, getting high marks for off-ball movement and roll gravity were also linked to offensive efficiency. In contrast, a lineup’s defensive rating was most highly correlated with its players’ total interior defense grades (in blue, on the right). Being skilled at perimeter defense and defensive rebounding also helped to prevent the other team from scoring. One immediately apparent challenge of optimizing lineup fit is that the players who have the skills critical to creating a high-powered offense often lack the skills necessary to build a stingy defense (and vice versa), as we see from the following matrix of correlation coefficients between individual talent grades.
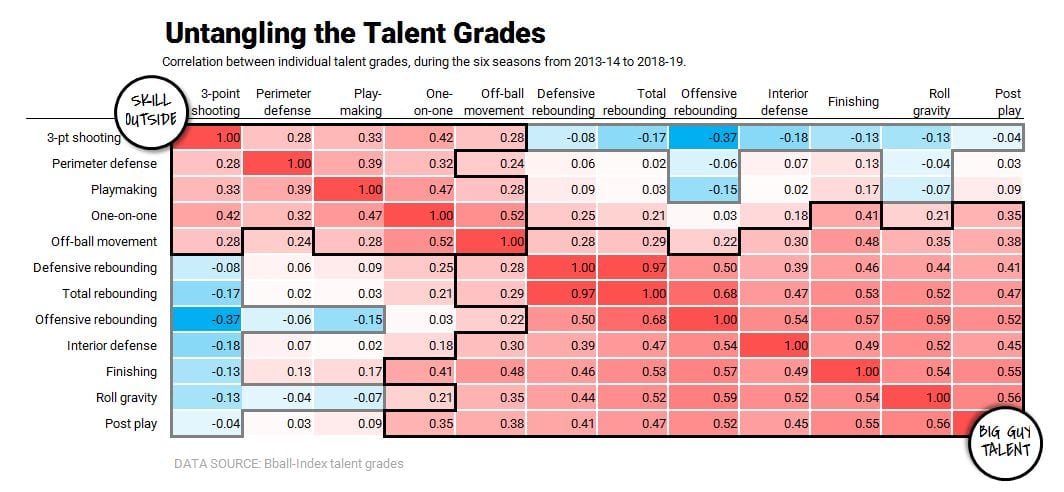
For example, check out the top row of the table above – individual grades for 3-point shooting were negatively correlated with grades for interior defense (in blue), indicating that players were not usually good at both of these things. At the same time, the two big blocks of red cells indicate positively correlated grades – i.e., skills that tended to come as packaged deals. Proficiencies with 3-point shooting, play-making, and perimeter defense were all correlated; they are skills that perimeter players (i.e., guards + wings) tend to do better than interior players. Talent grades for interior defense, roll gravity, post play, finishing, and rebounding (offensive, defensive, and total) were also correlated; these are typically the skills of the big man.
So, the initial decision to make when optimizing lineup fit might be: how many bigs should we put on the court together? To find an answer to this question I sorted players by position – using the guard-wing-big labels found at Bball-Index which I defined previously with Synergy play-type data — and then calculated offensive and defensive ratings for lineups with various numbers of bigs and guards.

As you might have guessed, putting more big men in a lineup improved (i.e., lowered) its defensive rating, from 108.8 points per 100 possessions (with one or no bigs on the court) down to 104.1 (with three or more bigs, in blue). Conversely, adding more guards tended to help on the other end of the court, raising a lineup’s offensive rating from 105.9 points per 100 possessions (with no guards on the court) up to 110.1 (with three or more guards, in red).
We can refine our breakdown of lineup ratings a bit further by incorporating defensive talent grades. We could consider any big man to be a “good” defender if his interior defense grade was an “A” or a “B” (i.e., in the top 40 percent of the league). Likewise, we’ll call a perimeter player a good defender if his perimeter defense grade was an “A” or a “B”. With these designations in mind, let’s take a look at how many “good” defenders it takes to make a sturdy defensive lineup.
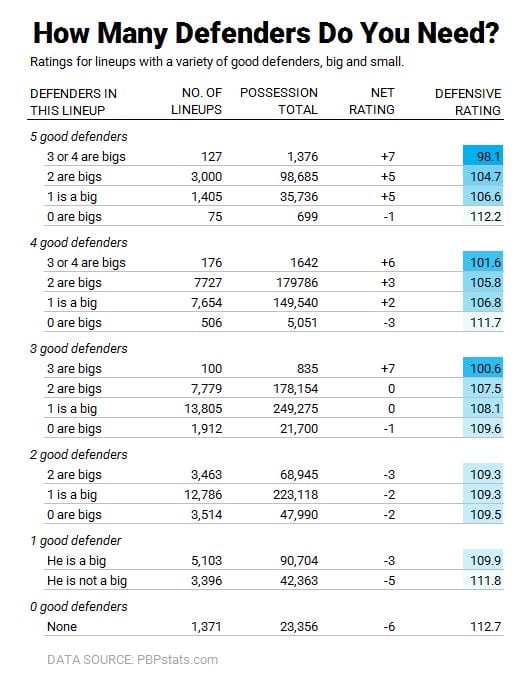
Two obvious trends emerge from the table above — 1. That having additional good defenders results in better defensive lineups (duh!) and 2. That defenders who are both good AND big are more helpful than defenders who are good but small (guards or wings). But, beyond those intuitive findings, there is also some unexpected nuance here.
It is sometimes said that a defense is only as strong as its weakest link, but these data actually suggest otherwise. Lineups with no good big defenders and three or more good perimeter defenders (109.6 points allowed per 100 possessions or worse) were no better on defense than lineups with exactly one good big defender (109.9). In other words, one good rim protector CAN make up for a defensive weak link…or maybe even two. Moreover, lineups with three or more good defenders broke even (i.e., they posted non-negative net ratings) just as long as one of those good defenders was big. That’s a pretty useful rule of thumb to remember: effective lineups tend to have at least three good defenders, one of whom is big.
But we can go quite a bit further than this — by incorporating some of the offensive talent grades into our lineup fit analysis. I used k-means clustering (kmeans in R) to group players into 12 archetypes using their percentile ranks in eight of the talent grades: 3-point shooting, off-ball movement, one-on-one, playmaking, roll gravity, total rebounding, perimeter defense, and interior defense (I excluded the other four grades for finishing, post play, offensive rebounding, and defensive rebounding because they were somewhat redundant for my purposes). Below you can find the average talent grades for each of the 12 types of player.

Based on these average grades, I labeled the 12 algorithmically-defined groups of players as shooting specialists, all-around studs, perimeter scorers, stretch-4s, pass-first playmakers, 3-and-D wings, rolling rim protectors, rim-protecting specialists, rebounding specialists, defensive pests, and G-League call-ups. Talent grades change from year-to-year, so some players were classified as belonging to multiple archetypes, depending on the season. For each archetype, I also listed four exemplars who fit the type in multiple seasons.
Now, before we delve into figuring out which of these player types form effective combinations within lineups, let’s make some naive models that ignore lineup fit as a point of reference. I evaluated three multivariable models — one for net ratings, one for offensive ratings, and one for defensive ratings. For explanatory variables, I counted up the number of players from each archetype that were found in each lineup and estimated the linear relationship between archetype counts and lineup ratings. These models provide mutually-adjusted estimates of the effect of adding one additional player from a particular archetype to a lineup but they do NOT have interaction terms to help describe how player types might fit together.
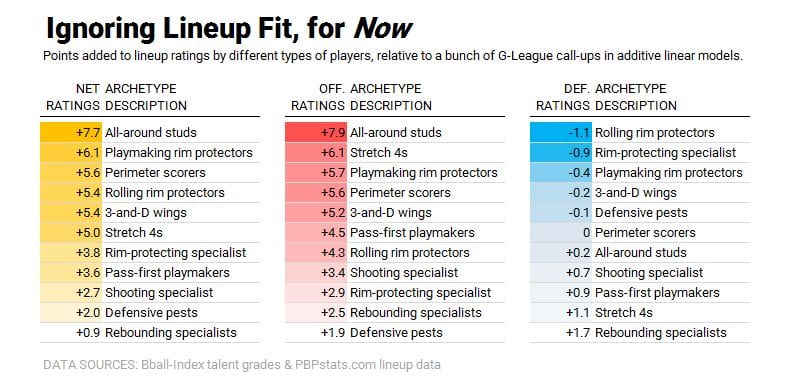
Using the G-League call-ups as a reference group, these models show the benefit of having a player from each archetype in the lineup. With all of their many talents, all-around studs like LeBron James and Kevin Durant are (not surprisingly) the most beneficial in aggregate (+7.7 in net rating). On offense, stretch-4s, playmaking rim protectors, and perimeter scorers were all also worth 5+ points per 100 possessions over a replacement-level player. On defense, rolling rim-protectors, rim-protecting specialists, playmaking rim-protectors, 3-and-D wings, and defensive pests all nudged things in a beneficial direction.
Building upon these naive linear models we can start evaluating interactions between player archetypes to find combinations that are synergistic or redundant. For starters, I looked at all of the possible two-way interactions between the 12 player archetypes. In each instance, I subset the data to focus on lineups with zero or one player from each of the archetypes of interest and then compared the multivariable additive model to the multivariable model with an interaction term for the two player archetypes of interest. Below are the eight unique two-way interactions (each listed twice) that were found to be statistically significant in these models. Five of the interactions indicate archetype combinations that are better than one would expect based on the additive models and three of the interactions indicate archetype combinations that are worse than one would expect.
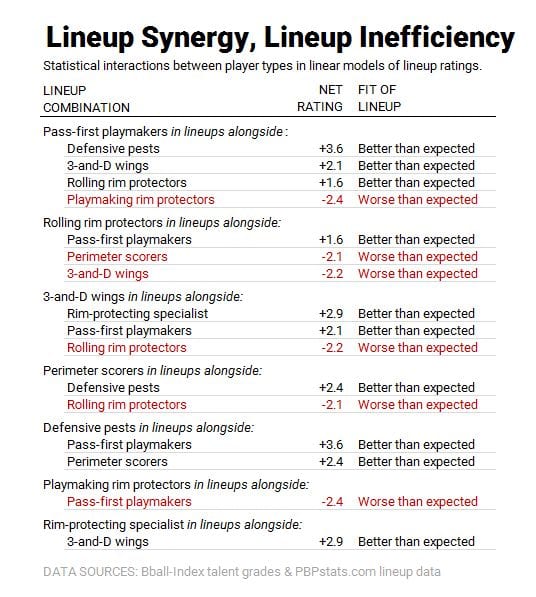
The archetypes which were most dependent on a proper lineup fit were pass-first playmakers, rolling rim-protectors, and 3-and-D wings. These archetypes needed to be used in combination with the appropriate teammates in order to be effective. Interestingly, the archetypes that were least dependent on lineup fit were all-around studs, stretch-4s, and shooting specialists, all of which had an average 3-point shooting grade of a “B” or better. Apparently, any lineup could benefit from more perimeter shooting!
To understand a little better how these interaction terms work, let’s take a look at two combos that involve pass-first playmakers — one that represents a synergistic archetype combination and one that represents a redundant one.
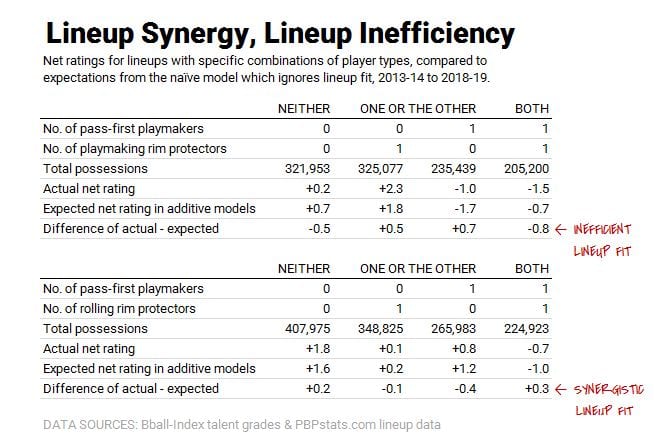
Our naive additive model estimates that all of the lineups with one pass-first playmaker and zero playmaking rim protectors would have a collective net rating of -1.7 whereas such lineups have actually performed better than that, at -1.0. Likewise, the naive additive model estimates that all of the lineups with one playmaking rim protector and zero pass-first playmakers would have a collective net rating of +1.8 whereas they have actually performed better than that, at +2.3. The naive model suggests that lineups with one of each of these archetypes — a pass-first playmaker and a playmaking rim protector — had a net rating LESS than what the additive model would suggest. This pattern indicates the combo of pass-first playmaker and playmaking rim protector (think: Rajon Rondo + Anthony Davis) tends to be an inefficient one, presumably because there is a redundancy of playmaking and a lack of perimeter shooting.
On the other hand, pass-first playmakers fit perfectly alongside rolling rim protectors (think: Ricky Rubio + Rudy Gobert or Ray Felton + Steven Adams). That’s because rolling rim protectors don’t make plays for themselves, they rely on their teammates to help set them up.
As a result, having two or more rolling rim protectors in a lineup at the same time tends to be inefficient, leading to cluttered court spacing. Similarly, we can look at what happens when two or more players of any other archetype share the court together.
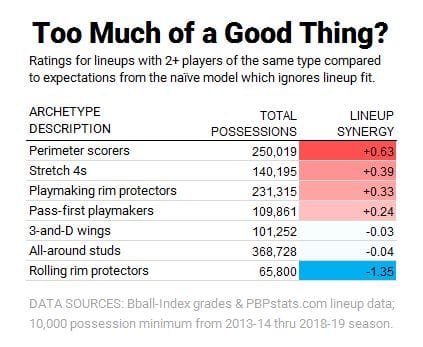
As we saw above, two of the best shooting archetypes — perimeter scorers and stretch-4s — can be added seamlessly to most lineups and having two players of either type is even better than having just one.
There are many other ways to look at lineup fit, but this post is getting pretty long already so I’ll just mention that I tinkered with some three-way interaction terms and explored the random forest algorithm, too. There are also plenty of other ways to define player archetypes other than using talent grades (e.g., by incorporating anthropometric measures) and plenty of other outcomes to investigate beyond net ratings (e.g., shot quality). Things would be simplified a bit in a scenario where we had four pieces of the lineup in place and we were simply choosing between two competing archetypes to fill the last spot.
The bottom line is that optimizing lineup fit has the potential to enhance individual players’ talents, allowing the whole to become more than the sum of its parts.